
Architecture and Planning
GATE AR Section B2.3: Infrastructure Planning PYQs
Build your understanding with focused practice from past exam papers.
Questions 21–30 of 44. Imported answers require independent review unless marked reviewed.
Question 73
Open questionAR-B2MCQ2 marksNeeds review
Match the items in Group-I with the most appropriate stages of travel demand modeling in Group-II.
Group-I: (P) US-EPA’s MOVES; (Q) Fratar Model; (R) Growth Factor Model; (S) User Equilibrium.
Group-II: (1) Trip Assignment; (2) Trip Production; (3) Trip Distribution; (4) Mobile source emission estimation; (5) Destination Choice
Your answerChoose one option.
Log in to check the answer
You can attempt this question now. Sign in to view the answer key, explanations and discussion.Log in to check answerQuestion 75
Open questionAR-B2MCQ2 marksNeeds review
As per IRC 11:1962, separate bicycle tracks may be provided when the peak hour ________.
Which of the following statement(s) can be used to correct fill in the blank?
(P) Bicycle traffic is 400 bicycles/hour or more and the volume of motorized vehicles is 100-200 vehicles/hour
(Q) Bicycle traffic is 100 bicycles/hour or more and the volume of motorized vehicles exceed 200 vehicles/hour
(R) Bicycle traffic is 100-200 bicycles/hour and the volume of motorized vehicle is 100-200 vehicles/hour
Your answerChoose one option.
Log in to check the answer
You can attempt this question now. Sign in to view the answer key, explanations and discussion.Log in to check answerQuestion 81
Open questionAR-B2NAT2 marksNeeds review
A given zone is characterized in the following tables in terms of household size, and vehicle ownership. Table I shows the trip rate of households, and Table II shows the household composition. For households of size two and above, having one or more vehicles, the total daily home-based trips made are _________ [in integer].
Table I: Trip rate of households
(unit: number of daily home-based trips per household)
Vehicles / household | Persons / household: One (1) | Two (2) | Three & above (3+) |
|---|---|---|---|
Zero (0) | 0.5 | 2 | 4 |
One (1) | 0.6 | 2.5 | 5 |
Two & above (2+) | 1 | 3 | 6 |
Table II: Household composition of zone
(unit: number of households)
Vehicles / household | Persons / household: One (1) | Two (2) | Three & above (3+) |
|---|---|---|---|
Zero (0) | 100 | 200 | 150 |
One (1) | 200 | 300 | 200 |
Two & above (2+) | 50 | 100 | 50 |
Log in to check the answer
You can attempt this question now. Sign in to view the answer key, explanations and discussion.Log in to check answerQuestion 15
Open questionARMCQ1 markNeeds review
Arrange the following road types in descending order of accessibility.
(P) Arterial Road
(Q) Expressway
(R) Collector Road
(S) Local Street
Your answerChoose one option.
Log in to check the answer
You can attempt this question now. Sign in to view the answer key, explanations and discussion.Log in to check answerQuestion 66
Open questionARMCQ1 markNeeds review
Which of the following is the National Electronic Toll Collection System implemented by the National Payment Corporation of India?
Your answerChoose one option.
Log in to check the answer
You can attempt this question now. Sign in to view the answer key, explanations and discussion.Log in to check answerQuestion 68
Open questionARMCQ1 markNeeds review
Identify the following traffic interchange.
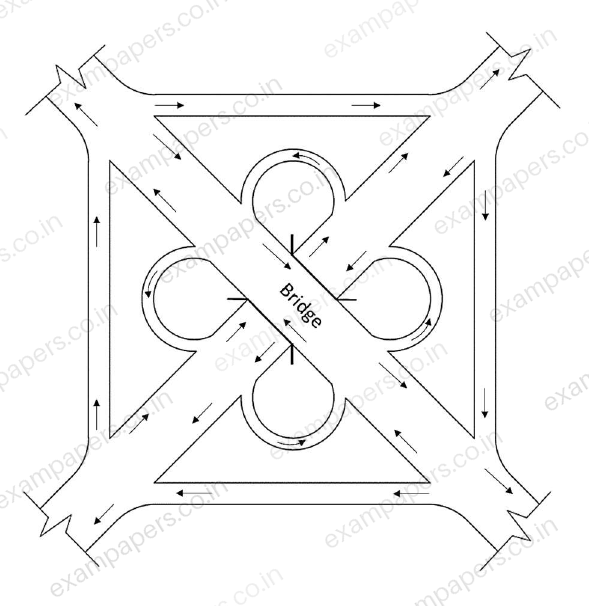
Your answerChoose one option.
Log in to check the answer
You can attempt this question now. Sign in to view the answer key, explanations and discussion.Log in to check answerQuestion 71
Open questionARNAT1 markNeeds review
The measured spot speeds (in km/h) of 10 vehicles from a traffic stream are 45, 35, 25, 51, 45, 38, 61, 42, 47, and 49. The Time Mean Speed of the traffic stream (in km/h, rounded off to one decimal place) is __________.
Log in to check the answer
You can attempt this question now. Sign in to view the answer key, explanations and discussion.Log in to check answerQuestion 73
Open questionARMCQ2 marksNeeds review
Match the models in Group I with their corresponding applications in Group II.
Group I | Group II |
|---|---|
(P) Logit model | (1) Trip assignment |
(Q) Greenshield model | (2) Modal split |
(R) Gravity model | (3) Traffic flow |
(S) Multiple regression model | (4) Trip generation |
| (5) Trip distribution |
Your answerChoose one option.
Log in to check the answer
You can attempt this question now. Sign in to view the answer key, explanations and discussion.Log in to check answerQuestion 78
Open questionARMSQ2 marksNeeds review
In the transportation network given below, P, Q, R, S, T, and U are the nodes and values mentioned on the links denote time in minutes. Which of the following options represent the minimum spanning tree?
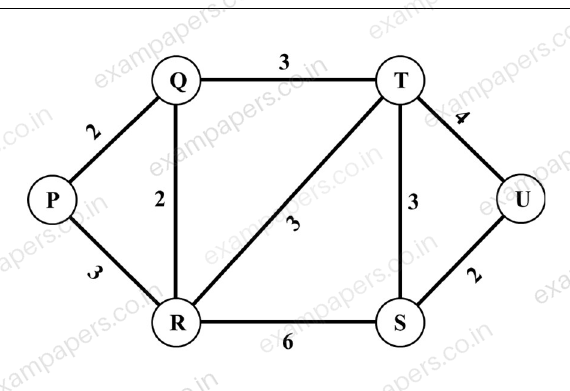
Your answerSelect all correct options. You can choose more than one.
Log in to check the answer
You can attempt this question now. Sign in to view the answer key, explanations and discussion.Log in to check answerQuestion 79
Open questionARNAT2 marksNeeds review
A vehicle count survey (in Passenger Car Unit) is conducted on a mid-block section of a road at regular intervals of 15 minutes from 8:00 AM to 10:00 AM. Based on the data given in Table below, the Peak Hour Factor (rounded off to two decimal places) for the given survey duration is __________.
Time Interval | Passenger Car Unit |
|---|---|
8:00 AM – 8:15 AM | 212 |
8:15 AM – 8:30 AM | 248 |
8:30 AM – 8:45 AM | 272 |
8:45 AM – 9:00 AM | 315 |
9:00 AM – 9:15 AM | 337 |
9:15 AM – 9:30 AM | 405 |
9:30 AM – 9:45 AM | 320 |
9:45 AM – 10:00 AM | 267 |
Log in to check the answer
You can attempt this question now. Sign in to view the answer key, explanations and discussion.Log in to check answer