
Architecture and Planning
GATE AR topic:infrastructure-planning PYQs
Build your understanding with focused practice from past exam papers.
How to practice topic:infrastructure-planning
Attempt a question, record the concept and assumptions, then check the available answer. Rework mistakes after revising the relevant concepts. Topic tags can overlap; review the question context.
Questions 1–10 of 44. Imported answers require independent review unless marked reviewed.
Question 70
Open questionAR-B2MSQ1 markNeeds review
Which of the following options is/are means of first and last mile connectivity with respect to urban transit systems?
Your answerSelect all correct options. You can choose more than one.
Log in to check the answer
You can attempt this question now. Sign in to view the answer key, explanations and discussion.Log in to check answerQuestion 71
Open questionAR-B2NAT1 markNeeds review
Based on Greenshield’s model, a speed-density relationship is developed on the data of a traffic stream. This relationship is represented as v = 75 − 0.03k, where v (in km/hr) is the mean speed at density k (in vehicle/km). The jam density (in vehicle/km) of this traffic stream is ____________ (in integer).
Log in to check the answer
You can attempt this question now. Sign in to view the answer key, explanations and discussion.Log in to check answerQuestion 79
Open questionAR-B2NAT2 marksNeeds review
The demand function of a light rail transit system (LRTS) of a city is represented as Q = 4300 – 85P, where Q is the ridership/day and P is the fare/ride. If the existing fare of Rs. 30 per ride is reduced to Rs. 25 per ride, then the consequent increase in ridership of the LRTS (in percentage) is __________ (rounded off to two decimal places).
Log in to check the answer
You can attempt this question now. Sign in to view the answer key, explanations and discussion.Log in to check answerQuestion 80
Open questionAR-B2NAT2 marksNeeds review
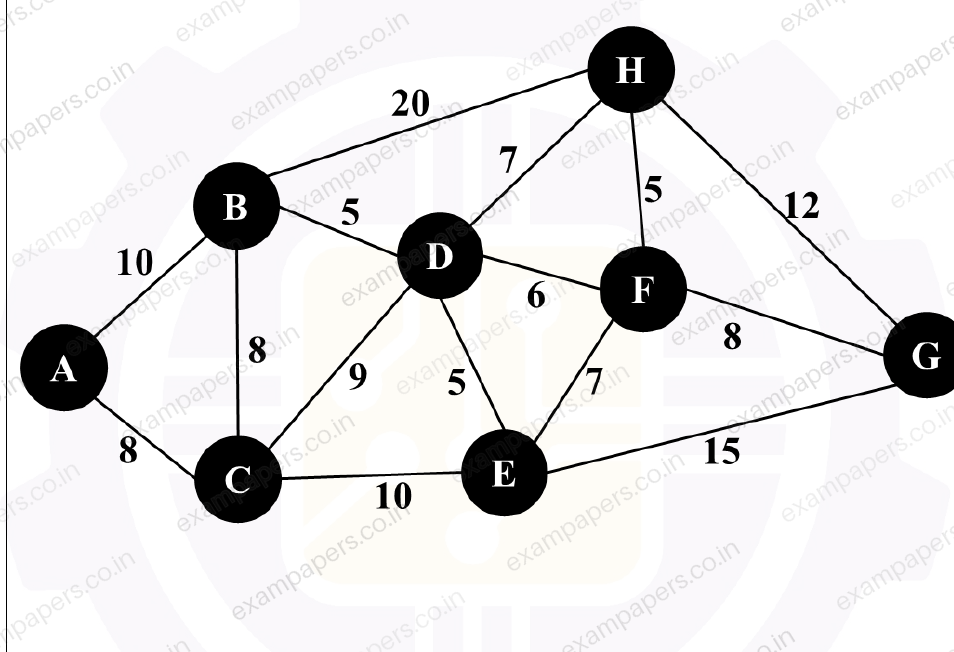
In a transport network, all the nodes (represented by A, B, C, D, E, F, G, H) and their connecting links are shown in the figure below. The values mentioned alongside the links represent the travel time (in minutes) between nodes. Following the shortest path, the minimum time required to commute from node A to node G (in minutes) is __________ (in integer).
Log in to check the answer
You can attempt this question now. Sign in to view the answer key, explanations and discussion.Log in to check answerQuestion 81
Open questionAR-B2NAT2 marksNeeds review
A classified vehicle count was conducted in the midblock of a two-lane one-way collector road during peak hour (08:00 A.M. – 09:00 A.M.) on a weekday. The vehicle counts and corresponding passenger car unit (PCU) values per unit are shown in the table below. If the maximum design capacity per lane of that road is 1300 PCU/hr, then the volume to capacity ratio of that road is __________ (rounded off to two decimal places).
Vehicle Type | Hourly Vehicle Count (08:00 A.M. – 09:00 A.M.) | PCU Value |
|---|---|---|
Bus | 52 | 2.50 |
Truck | 24 | 3.00 |
Car | 720 | 1.00 |
Motorized Two-Wheeler | 1050 | 0.50 |
Auto Rickshaw | 275 | 0.80 |
E-Rickshaw | 410 | 0.80 |
Bicycle | 90 | 0.30 |
Log in to check the answer
You can attempt this question now. Sign in to view the answer key, explanations and discussion.Log in to check answerQuestion 49
Open questionARNAT2 marksNeeds review
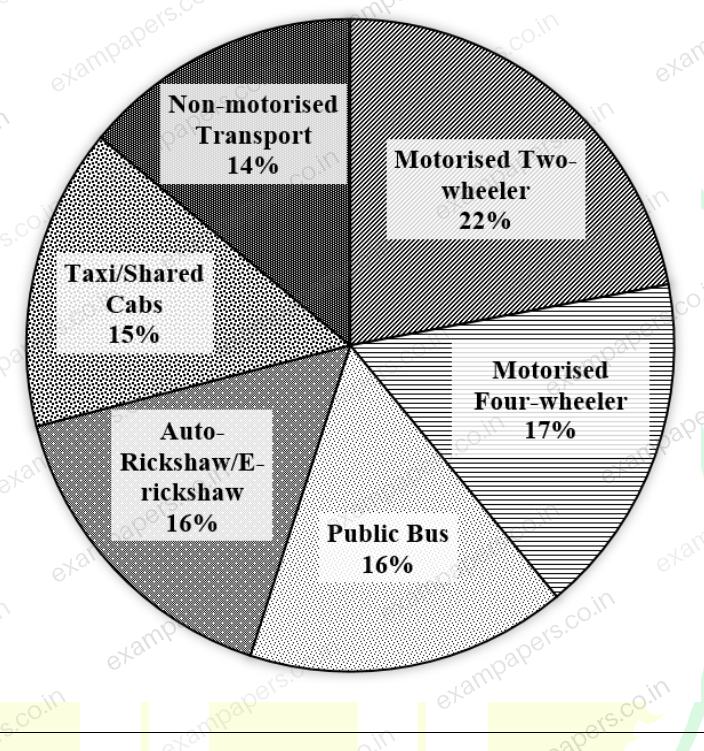
A city aims to introduce Metro rail as a sustainable public transport, with a projected daily ridership of 3,67,200 which is expected to shift 18% of the daily trips from other existing modes. The existing modal share (in percentage) is shown in the figure. If half of the above modal shift is expected to replace trips by Motorised Two-wheeler and Motorised Four-wheeler in 2:1 ratio, the trips only by Motorised Two-wheeler, post modal shift to Metro is ________________. (answer in integer)
Log in to check the answer
You can attempt this question now. Sign in to view the answer key, explanations and discussion.Log in to check answerQuestion 71
Open questionAR-B2MSQ1 markNeeds review
Select the correct statement(s) with regard to Traffic Analysis Zones (TAZs).
Your answerSelect all correct options. You can choose more than one.
Log in to check the answer
You can attempt this question now. Sign in to view the answer key, explanations and discussion.Log in to check answerQuestion 75
Open questionAR-B2MCQ2 marksNeeds review
Match the following Curves in Group-I with their corresponding uses in Group-II.
Group-I:
(P) Mass Curve
(Q) Lorenz Curve
(R) Density Curve
(S) Horizontal Curve
Group-II:
(1) A graphical representation of income or wealth inequality
(2) A graphical representation of cumulative inflow (supply) and outflow (demand) over time
(3) Shows the relationship between the price of a good or service and the quantity demanded within a specified time frame
(4) Provides a transition between tangent strips of roadway allowing a vehicle to negotiate a turn
(5) An idealised representation of distribution in which the area under the curve is defined to be 1
Your answerChoose one option.
Log in to check the answer
You can attempt this question now. Sign in to view the answer key, explanations and discussion.Log in to check answerQuestion 79
Open questionAR-B2NAT2 marksNeeds review
The spot speeds (in km/h) of eight vehicles in a traffic stream are 42, 52, 56, X, 53, 62, 65, and 48. X is the spot speed of the fourth vehicle. The Time Mean Speed of the traffic stream is 56.25 km/h. After determining the value of X, the calculated Space Mean Speed of the traffic stream is ______________ km/h. (rounded off to two decimal places)
Log in to check the answer
You can attempt this question now. Sign in to view the answer key, explanations and discussion.Log in to check answerQuestion 80
Open questionAR-B2NAT2 marksNeeds review
An individual choses a transport mode for a particular trip based on three attributes i.e., cost of journey (X), In-vehicle travel time to each destination (Y), and Out-of-vehicle time taken to access mode at respective stops (Z). The values for these attributes for three modes Rail, Bus and Para-transit are given in the table. If the general utility (U) equation is U = − 0.5X − 0.3Y − 0.4Z, using Logit model, the estimated probability of choosing Bus is ______________. (rounded off to two decimal places)
Mode | X = Cost of journey (in INR) | Y = In-Vehicle travel time (in min) | Z = Out-of-Vehicle travel time (in min)
Rail | 20 | 20 | 10
Bus | 10 | 40 | 7.5
Para-transit | 15 | 35 | 5
Log in to check the answer
You can attempt this question now. Sign in to view the answer key, explanations and discussion.Log in to check answer