
Architecture and Planning
GATE AR year:2022 PYQs
Build your understanding with focused practice from past exam papers.
Questions 71–80 of 81. Imported answers require independent review unless marked reviewed.
Question 71
Open questionARNAT1 markNeeds review
The measured spot speeds (in km/h) of 10 vehicles from a traffic stream are 45, 35, 25, 51, 45, 38, 61, 42, 47, and 49. The Time Mean Speed of the traffic stream (in km/h, rounded off to one decimal place) is __________.
Log in to check the answer
You can attempt this question now. Sign in to view the answer key, explanations and discussion.Log in to check answerQuestion 72
Open questionARNAT1 markNeeds review
In a township, the price of each house was 25,00,000 (in Indian Rupees) last month. The number of houses sold in a month (Q in thousands) is sensitive to the price of the house (P in Indian Rupees) and establishes a relationship as Q = 665 − 0.0015P. If the price of each house increases by 20% in the current month, then the decrease in sale of the houses (in percentage, rounded off to two decimal places) compared to last month will be __________.
Log in to check the answer
You can attempt this question now. Sign in to view the answer key, explanations and discussion.Log in to check answerQuestion 73
Open questionARMCQ2 marksNeeds review
Match the models in Group I with their corresponding applications in Group II.
Group I | Group II |
|---|---|
(P) Logit model | (1) Trip assignment |
(Q) Greenshield model | (2) Modal split |
(R) Gravity model | (3) Traffic flow |
(S) Multiple regression model | (4) Trip generation |
| (5) Trip distribution |
Your answerChoose one option.
Log in to check the answer
You can attempt this question now. Sign in to view the answer key, explanations and discussion.Log in to check answerQuestion 74
Open questionARMCQ2 marksNeeds review
Match the proponents in Group I with the corresponding theories in Group II.
Group I | Group II |
|---|---|
(P) James Q Wilson and George K. Kelling | (1) Creative Class |
(Q) Sherry Arnstein | (2) Right to City |
(R) Henry Lefebvre | (3) Drive-in Culture |
(S) Richard Florida | (4) Ladder of Citizen Participation |
| (5) Broken Window |
Your answerChoose one option.
Log in to check the answer
You can attempt this question now. Sign in to view the answer key, explanations and discussion.Log in to check answerQuestion 75
Open questionARMCQ2 marksNeeds review
Match the Artists/Scientists in Group I with their corresponding contributions in Group II.
Group I | Group II |
|---|---|
(P) Robert Park and Louis Wirth | (1) Poverty Map |
(Q) Jacob August Riis | (2) Cholera Map |
(R) Charles Booth | (3) Tenement Shelter Photography |
(S) John Snow | (4) Urban Ethnography |
| (5) Underground Sewer Systems |
Your answerChoose one option.
Log in to check the answer
You can attempt this question now. Sign in to view the answer key, explanations and discussion.Log in to check answerQuestion 76
Open questionARMCQ2 marksNeeds review
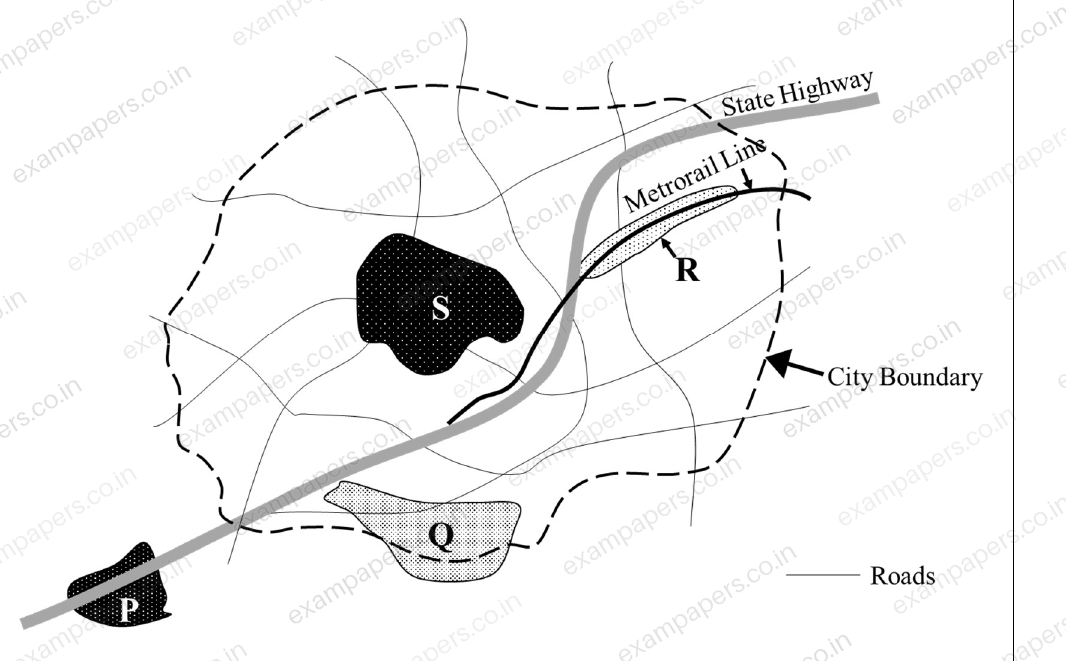
In the conceptual diagram of the city given below, P, Q, R, and S refer to urban patterns. Among the choices given below, the correct association is
Your answerChoose one option.
Log in to check the answer
You can attempt this question now. Sign in to view the answer key, explanations and discussion.Log in to check answerQuestion 77
Open questionARMSQ2 marksNeeds review
Which among the following is/are the component(s) of the assimilative carrying capacity of urban environment?
Your answerSelect all correct options. You can choose more than one.
Log in to check the answer
You can attempt this question now. Sign in to view the answer key, explanations and discussion.Log in to check answerQuestion 78
Open questionARMSQ2 marksNeeds review
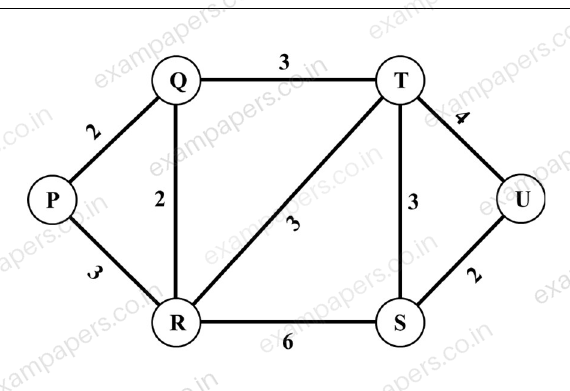
In the transportation network given below, P, Q, R, S, T, and U are the nodes and values mentioned on the links denote time in minutes. Which of the following options represent the minimum spanning tree?
Your answerSelect all correct options. You can choose more than one.
Log in to check the answer
You can attempt this question now. Sign in to view the answer key, explanations and discussion.Log in to check answerQuestion 79
Open questionARNAT2 marksNeeds review
A vehicle count survey (in Passenger Car Unit) is conducted on a mid-block section of a road at regular intervals of 15 minutes from 8:00 AM to 10:00 AM. Based on the data given in Table below, the Peak Hour Factor (rounded off to two decimal places) for the given survey duration is __________.
Time Interval | Passenger Car Unit |
|---|---|
8:00 AM – 8:15 AM | 212 |
8:15 AM – 8:30 AM | 248 |
8:30 AM – 8:45 AM | 272 |
8:45 AM – 9:00 AM | 315 |
9:00 AM – 9:15 AM | 337 |
9:15 AM – 9:30 AM | 405 |
9:30 AM – 9:45 AM | 320 |
9:45 AM – 10:00 AM | 267 |
Log in to check the answer
You can attempt this question now. Sign in to view the answer key, explanations and discussion.Log in to check answerQuestion 80
Open questionARNAT2 marksNeeds review
A land owner has shown interest in a Town Planning Scheme. Based on the details of the scheme given in the following Table, the estimated Net Benefit to the land owner after land development (in Indian Rupees, in integer) is __________.
Item | Value |
|---|---|
Original plot size | 500 Sq. m |
Original land value | 1200 Indian Rupees per Sq.m |
Plot deduction for development | 40% |
Developed land value | 2800 Indian Rupees per Sq.m |
Total betterment cost to be paid by the land owner | 50% of the increased total land value |
Log in to check the answer
You can attempt this question now. Sign in to view the answer key, explanations and discussion.Log in to check answer