
Civil Engineering
GATE CE concept:speed PYQs
Build your understanding with focused practice from past exam papers.
Questions 11–20 of 41. Imported answers require independent review unless marked reviewed.
Question 62
Open questionCE2NAT2 marksNeeds review
A horizontal curve of radius 1080 m (with transition curves on either side) in a Broad Gauge railway track is designed and constructed for an equilibrium speed of 70 kmph. However, a few years after construction, the Railway Authorities decided to run express trains on this track. The maximum allowable cant deficiency is 10 cm.
The maximum restricted speed (in kmph) of the express trains running on this track is ______________ (rounded off to the nearest integer).
Log in to check the answer
You can attempt this question now. Sign in to view the answer key, explanations and discussion.Log in to check answerQuestion 63
Open questionce-1NAT2 marksNeeds review
The figure presents the trajectories of six vehicles within a time-space domain. The number in the parentheses represents unique identification of each vehicle.
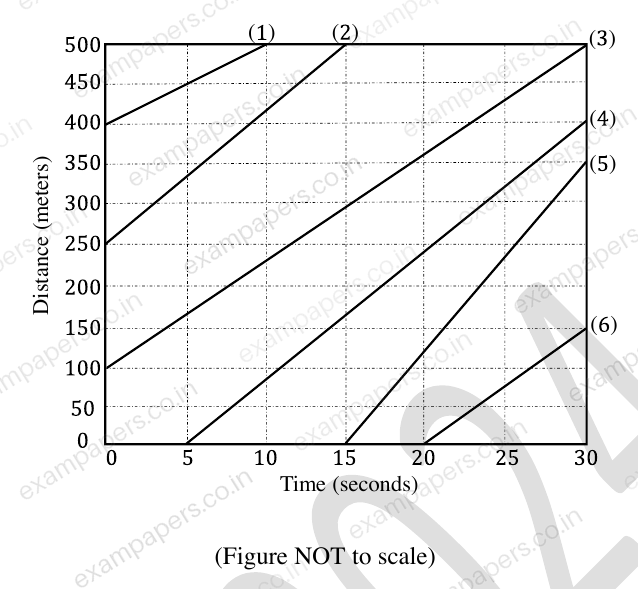
The mean speed (in km/hr) of the vehicles in the entire time-space domain is ______________ (rounded off to the nearest integer).
Log in to check the answer
You can attempt this question now. Sign in to view the answer key, explanations and discussion.Log in to check answerQuestion 63
Open questionCE2NAT2 marksNeeds review
A vertical summit curve on a freight corridor is formed at the intersection of two gradients, +3.0% and −5.0%.
Assume the following:
Only large-sized trucks are allowed on this corridor
Design speed = 80 kmph
Eye height of truck drivers above the road surface = 2.30 m
Height of object above the road surface for which trucks need to stop = 0.35 m
Total reaction time of the truck drivers = 2.0 s
Coefficient of longitudinal friction of the road = 0.36
Stopping sight distance gets compensated on the gradient
The design length of the summit curve (in meters) to accommodate the stopping sight distance is __________ (rounded off to 2 decimal places).
Log in to check the answer
You can attempt this question now. Sign in to view the answer key, explanations and discussion.Log in to check answerQuestion 46
Open questionCEMCQ2 marksNeeds review
A plot of speed-density relationship (linear) of two roads (Road A and Road B) is shown in the figure.
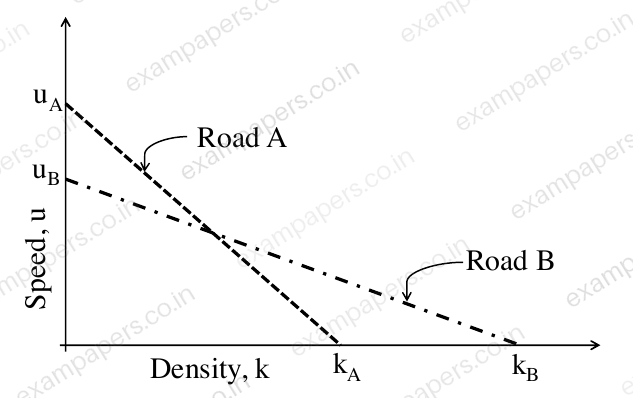
If the capacity of Road A is C_A and the capacity of Road B is C_B, what is
?Your answerChoose one option.
Log in to check the answer
You can attempt this question now. Sign in to view the answer key, explanations and discussion.Log in to check answerQuestion 50
Open questionCE-2MSQ2 marksNeeds review
The figure presents the time-space diagram for when the traffic on a highway is suddenly stopped for a certain time and then released. Which of the following statements are true?
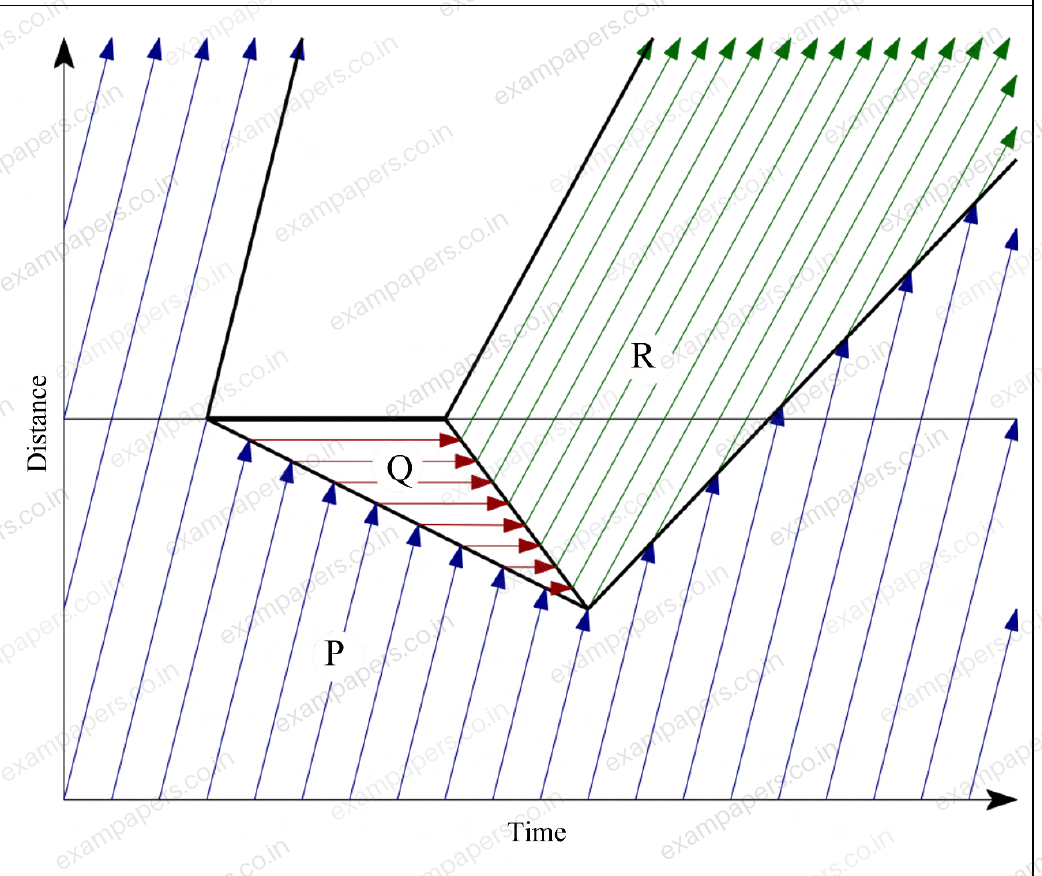
Your answerSelect all correct options. You can choose more than one.
Log in to check the answer
You can attempt this question now. Sign in to view the answer key, explanations and discussion.Log in to check answerQuestion 28
Open questionCEMSQ1 markNeeds review
A horizontal curve is to be designed in a region with limited space. Which of the following measure(s) can be used to decrease the radius of curvature?
Your answerSelect all correct options. You can choose more than one.
Log in to check the answer
You can attempt this question now. Sign in to view the answer key, explanations and discussion.Log in to check answerQuestion 28
Open questionCEMSQ1 markNeeds review
For a traffic stream,
is the space mean speed,
is the density,
is the flow,
is the free flow speed, and
is the jam density. Assume that the speed decreases linearly with density.Which of the following relation(s) is/are correct?
Your answerSelect all correct options. You can choose more than one.
Log in to check the answer
You can attempt this question now. Sign in to view the answer key, explanations and discussion.Log in to check answerQuestion 44
Open questionCEMCQ2 marksNeeds review
Consider the four points P, Q, R, and S shown in the Greenshields fundamental speed-flow diagram. Denote their corresponding traffic densities by
,
,
, and
, respectively. The correct order of these densities is 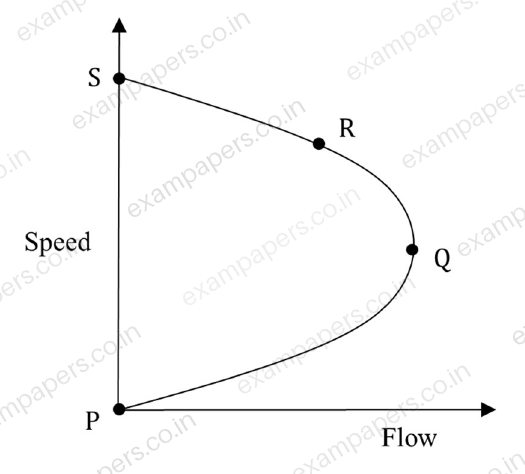
Your answerChoose one option.
Log in to check the answer
You can attempt this question now. Sign in to view the answer key, explanations and discussion.Log in to check answerQuestion 44
Open questionCEMCQ2 marksNeeds review
A single-lane highway has a traffic density of 40 vehicles/km. If the time-mean speed and space-mean speed are 40 kph and 30 kph, respectively, the average headway (in seconds) between the vehicles is
Your answerChoose one option.
Log in to check the answer
You can attempt this question now. Sign in to view the answer key, explanations and discussion.Log in to check answerQuestion 63
Open questionCENAT2 marksNeeds review
Assuming that traffic on a highway obeys the Greenshields model, the speed of a shockwave between two traffic streams (P) and (Q) as shown in the schematic is ______ kmph. (in integer)
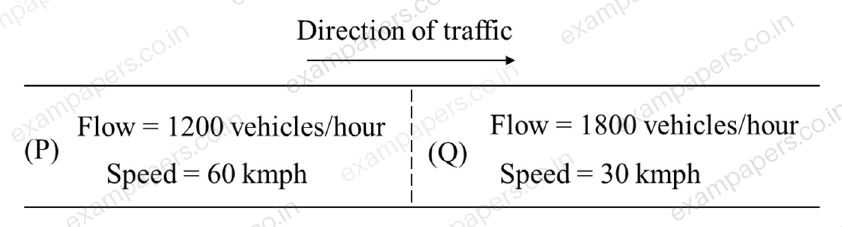
Log in to check the answer
You can attempt this question now. Sign in to view the answer key, explanations and discussion.Log in to check answer