
Civil Engineering
GATE CE topic:traffic-engineering PYQs
Build your understanding with focused practice from past exam papers.
Questions 31–40 of 44. Imported answers require independent review unless marked reviewed.
Question 45
Open questionCENAT2 marksNeeds review
Traffic volume count has been collected on a 2-lane road section, which needs upgradation due to severe traffic flow condition. Maximum service flow rate per lane is observed as 1280 veh/h at level of service ‘C’. The Peak Hour Factor is reported as 0.78125. Historical traffic volume count provides Annual Average Daily Traffic as 1220 veh/day. Directional split of the traffic flow is observed to be 60:40. Assuming that traffic stream consists of ‘All Cars’ and all drivers are ‘Regular Commuters’, the number of extra lane(s) (round off to the next higher integer) to be provided is _____.
Log in to check the answer
You can attempt this question now. Sign in to view the answer key, explanations and discussion.Log in to check answerQuestion 19
Open questionCEMCQ1 markNeeds review
The speed-density relationship in a mid-block section of a highway follows the Greenshield’s model. If the free flow speed is
and the jam density is
, the maximum flow observed on this section isYour answerChoose one option.
Log in to check the answer
You can attempt this question now. Sign in to view the answer key, explanations and discussion.Log in to check answerQuestion 21
Open questionCENAT1 markNeeds review
The maximum number of vehicles observed in any five minute period during the peak hour is 160. If the total flow in the peak hour is 1000 vehicles, the five minute peak hour factor (round off to 2 decimal places) is ________.
Log in to check the answer
You can attempt this question now. Sign in to view the answer key, explanations and discussion.Log in to check answerQuestion 44
Open questionCENAT2 marksNeeds review
The uniform arrival and uniform service rates observed on an approach road to a signalized intersection are 20 and 50 vehicles/minute, respectively. For this signal, the red time is 30
, the effective green time is 30
, and the cycle length is 60
. Assuming that initially there are no vehicles in the queue, the average delay per vehicle using the approach road during a cycle length (in
, round off to 2 decimal places) is __________Log in to check the answer
You can attempt this question now. Sign in to view the answer key, explanations and discussion.Log in to check answerQuestion 45
Open questionCENAT2 marksNeeds review
Average free flow speed and the jam density observed on a road stretch are 60 km/h and 120 vehicles/km, respectively. For a linear speed-density relationship, the maximum flow on the road stretch (in vehicles/h) is ________.
Log in to check the answer
You can attempt this question now. Sign in to view the answer key, explanations and discussion.Log in to check answerQuestion 46
Open questionCENAT2 marksNeeds review
Traffic on a highway is moving at a rate of 360 vehicles per hour at a location. If the number of vehicles arriving on this highway follows Poisson distribution, the probability (round off to 2 decimal places) that the headway between successive vehicles lies between 6 and 10 seconds is ________.
Log in to check the answer
You can attempt this question now. Sign in to view the answer key, explanations and discussion.Log in to check answerQuestion 46
Open questionCENAT2 marksNeeds review
The speed-density relationship of a highway is given as\n\n
\n\nwhere,
= speed in
per hour,
= density in vehicles per
. The maximum flow (in vehicles per hour, round off to the nearest integer) is __________Log in to check the answer
You can attempt this question now. Sign in to view the answer key, explanations and discussion.Log in to check answerQuestion 15
Open questionCEMCQ1 markNeeds review
The speed-density relationship for a road section is shown in the figure.
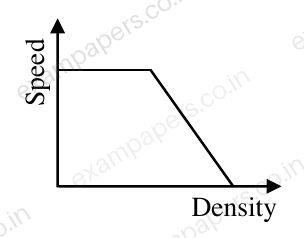
The shape of the flow-density relationship is
Your answerChoose one option.
Log in to check the answer
You can attempt this question now. Sign in to view the answer key, explanations and discussion.Log in to check answerQuestion 16
Open questionCEMCQ1 markNeeds review
A well-designed signalized intersection is one in which the
Your answerChoose one option.
Log in to check the answer
You can attempt this question now. Sign in to view the answer key, explanations and discussion.Log in to check answerQuestion 16
Open questionCEMCQ1 markNeeds review
Peak Hour Factor (PHF) is used to represent the proportion of peak sub-hourly traffic flow within the peak hour. If 15-minute sub-hours are considered, the theoretical possible range of PHF will be
Your answerChoose one option.
Log in to check the answer
You can attempt this question now. Sign in to view the answer key, explanations and discussion.Log in to check answer