
Electronics and Communication Engineering
GATE ECE concept:smith-chart PYQs
Build your understanding with focused practice from past exam papers.
How to practice concept:smith-chart
Attempt a question, record the concept and assumptions, then check the available answer. Rework mistakes after revising the relevant concepts. Topic tags can overlap; review the question context.
Questions 1–3 of 3. Imported answers require independent review unless marked reviewed.
Question 52
Open questionECMCQ2 marksNeeds review
A complex load (in Ω) is represented as
on the Smith chart. A co-axial cable with a characteristic impedance of 50 Ω is connected to the load. The new input impedance of the load now moves to a diametrically opposite point on the same Γ circle on the Smith chart.Which option is the nearest input impedance of the cable connected load (in Ω)?
Your answerChoose one option.
Log in to check the answer
You can attempt this question now. Sign in to view the answer key, explanations and discussion.Log in to check answerQuestion 13
Open questionECMCQ1 markNeeds review
The impedances
, for all
in the range
, map to the Smith chart asYour answerChoose one option.
Log in to check the answer
You can attempt this question now. Sign in to view the answer key, explanations and discussion.Log in to check answerQuestion 10
Open questionECMCQ1 markNeeds review
The points P, Q, and R shown on the Smith chart (normalized impedance chart) in the following figure represent:
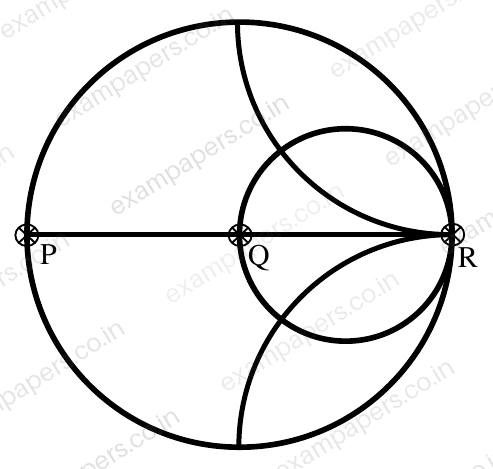
Your answerChoose one option.
Log in to check the answer
You can attempt this question now. Sign in to view the answer key, explanations and discussion.Log in to check answer