
Electronics and Communication Engineering
GATE ECE year:2019 PYQs
Build your understanding with focused practice from past exam papers.
Questions 11–20 of 65. Imported answers require independent review unless marked reviewed.
Question 1
Open questionECMCQ1 markNeeds review
Which one of the following functions is analytic over the entire complex plane?
Your answerChoose one option.
Log in to check the answer
You can attempt this question now. Sign in to view the answer key, explanations and discussion.Log in to check answerQuestion 2
Open questionECMCQ1 markNeeds review
The families of curves represented by the solution of the equation
for
and
, respectively, areYour answerChoose one option.
Log in to check the answer
You can attempt this question now. Sign in to view the answer key, explanations and discussion.Log in to check answerQuestion 3
Open questionECMCQ1 markNeeds review
Let
be the z-transform of a real-valued discrete-time signal
. If
has a zero at
, and
has a total of four zeros, which one of the following plots represents all the zeros correctly?Your answerChoose one option.
Log in to check the answer
You can attempt this question now. Sign in to view the answer key, explanations and discussion.Log in to check answerQuestion 4
Open questionECMCQ1 markNeeds review
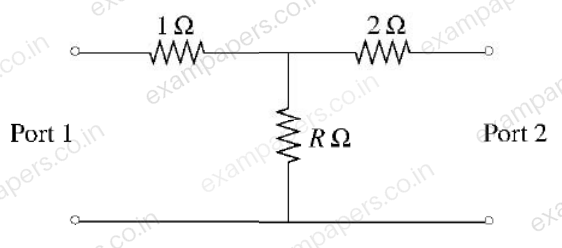
Consider the two-port resistive network shown in the figure.
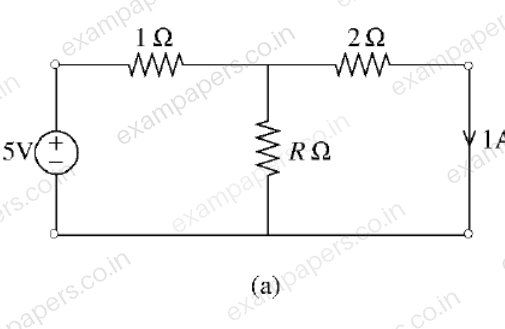
When an excitation of 5 V is applied across Port 1, and Port 2 is shorted, the current through the short circuit at Port 2 is measured to be 1 A (see (a) in the figure).
Now, if an excitation of 5 V is applied across Port 2, and Port 1 is shorted (see (b) in the figure),
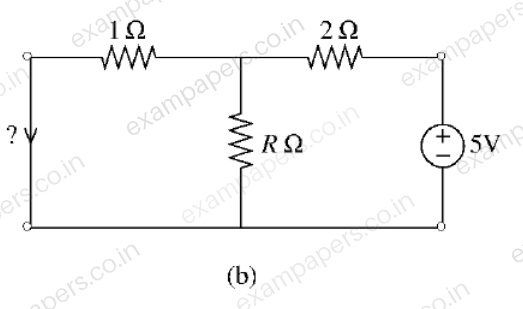
what is the current through the short circuit at Port 1?
Your answerChoose one option.
Log in to check the answer
You can attempt this question now. Sign in to view the answer key, explanations and discussion.Log in to check answerQuestion 5
Open questionECMCQ1 markNeeds review
Let
be the unit-step response of a causal system having a transfer function
that is,
. The forced response of the system isYour answerChoose one option.
Log in to check the answer
You can attempt this question now. Sign in to view the answer key, explanations and discussion.Log in to check answerQuestion 6
Open questionECMCQ1 markNeeds review
For an LTI system, the Bode plot for its gain is as illustrated in the figure shown. The number of system poles
and the number of system zeros
in the frequency range
is 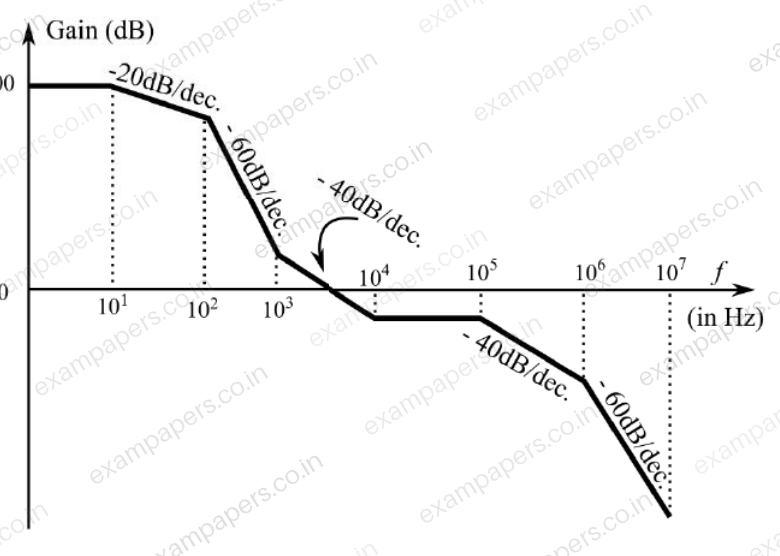
Your answerChoose one option.
Log in to check the answer
You can attempt this question now. Sign in to view the answer key, explanations and discussion.Log in to check answerQuestion 7
Open questionECMCQ1 markNeeds review
A linear Hamming code is used to map 4-bit messages to 7-bit codewords. The encoder mapping is linear. If the message 0001 is mapped to the codeword 0000111, and the message 0011 is mapped to the codeword 110010, then the message 0010 is mapped to
Your answerChoose one option.
Log in to check the answer
You can attempt this question now. Sign in to view the answer key, explanations and discussion.Log in to check answerQuestion 8
Open questionECMCQ1 markNeeds review
Which one of the following options describes correctly the equilibrium band diagram at
of a Silicon
configuration shown in the figure? 
Your answerChoose one option.
Log in to check the answer
You can attempt this question now. Sign in to view the answer key, explanations and discussion.Log in to check answerQuestion 9
Open questionECMCQ1 markNeeds review
The correct circuit representation of the structure shown in the figure is
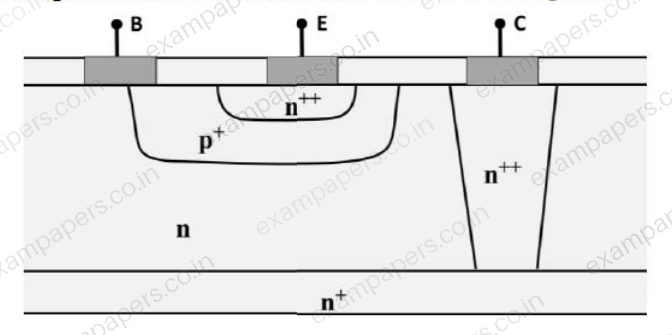
Your answerChoose one option.
Log in to check the answer
You can attempt this question now. Sign in to view the answer key, explanations and discussion.Log in to check answerQuestion 10
Open questionECMCQ1 markNeeds review
The figure shows the high-frequency C-V curve of a MOS capacitor (at T = 300 K) with
and no oxide charges. The flat-band, inversion, and accumulation conditions are represented, respectively, by the points
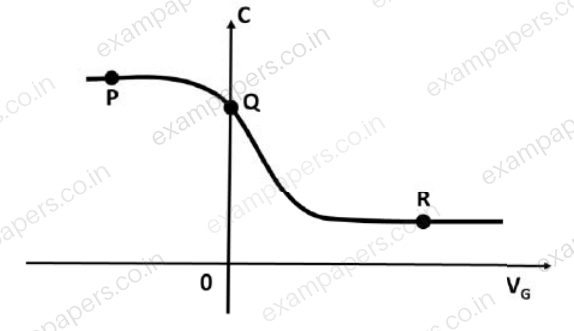
Your answerChoose one option.
Log in to check the answer
You can attempt this question now. Sign in to view the answer key, explanations and discussion.Log in to check answer