
Electrical Engineering
GATE EE Control Systems PYQs
Build your understanding with focused practice from past exam papers.
Questions 21–30 of 63. Imported answers require independent review unless marked reviewed.
Question 38
Open questionEEMCQ2 marksNeeds review
Consider a lead compensator of the form
The frequency at which this compensator produces maximum phase lead is 4 rad/s. At this frequency, the gain amplification provided by the controller, assuming asymptotic Bode-magnitude plot of
, is 6 dB. The values of
, respectively, areYour answerChoose one option.
Log in to check the answer
You can attempt this question now. Sign in to view the answer key, explanations and discussion.Log in to check answerQuestion 46
Open questionEENAT2 marksNeeds review
Consider the state-space description of an LTI system with matrices
For the input,
,
, the value of
for which the steady-state output of the system will be zero, is _________ (Round off to the nearest integer).Log in to check the answer
You can attempt this question now. Sign in to view the answer key, explanations and discussion.Log in to check answerQuestion 11
Open questionEEMCQ1 markNeeds review
The transfer function of a real system,
, is given as:
,where
,
,
and
are positive constants. This system cannot operate asYour answerChoose one option.
Log in to check the answer
You can attempt this question now. Sign in to view the answer key, explanations and discussion.Log in to check answerQuestion 17
Open questionEEMCQ1 markNeeds review
The Bode magnitude plot of a first order stable system is constant with frequency. The asymptotic value of the high frequency phase, for the system, is −180°. This system has
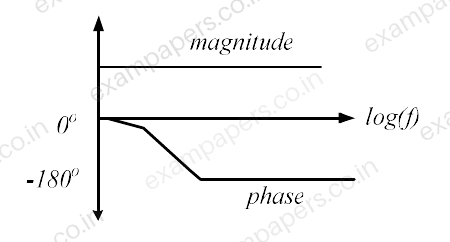
Your answerChoose one option.
Log in to check the answer
You can attempt this question now. Sign in to view the answer key, explanations and discussion.Log in to check answerQuestion 19
Open questionEEMCQ1 markNeeds review
The open loop transfer function of a unity gain negative feedback system is given by
. The range of
for which the system is stable, isYour answerChoose one option.
Log in to check the answer
You can attempt this question now. Sign in to view the answer key, explanations and discussion.Log in to check answerQuestion 37
Open questionEEMCQ2 marksNeeds review
An LTI system is shown in the figure where
The steady state output of the system, to the input
, is given as
. The values of ‘
’ and ‘
’ will be 
Your answerChoose one option.
Log in to check the answer
You can attempt this question now. Sign in to view the answer key, explanations and discussion.Log in to check answerQuestion 38
Open questionEEMCQ2 marksNeeds review
The open loop transfer function of a unity gain negative feedback system is given as
. The Nyquist contour in the s-plane encloses the entire right half plane and a small neighbourhood around the origin in the left half plane, as shown in the figure below. The number of encirclements of the point (
) by the Nyquist plot of
, corresponding to the Nyquist contour, is denoted as
. Then
equals to 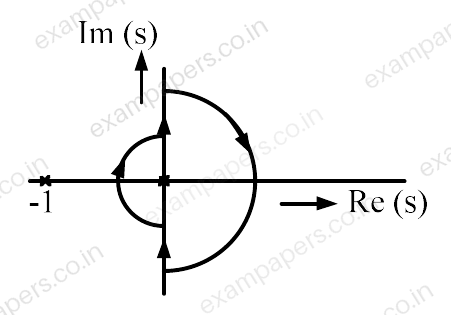
Your answerChoose one option.
Log in to check the answer
You can attempt this question now. Sign in to view the answer key, explanations and discussion.Log in to check answerQuestion 39
Open questionEEMCQ2 marksNeeds review
The damping ratio and undamped natural frequency of a closed loop system as shown in the figure, are denoted as
and
, respectively. The values of
and
are 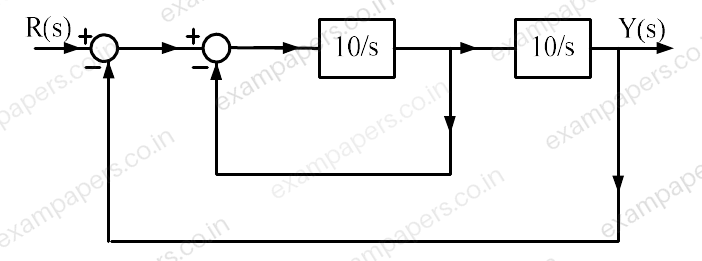
Your answerChoose one option.
Log in to check the answer
You can attempt this question now. Sign in to view the answer key, explanations and discussion.Log in to check answerQuestion 11
Open questionEEMCQ1 markNeeds review
For the closed-loop system shown, the transfer function
is 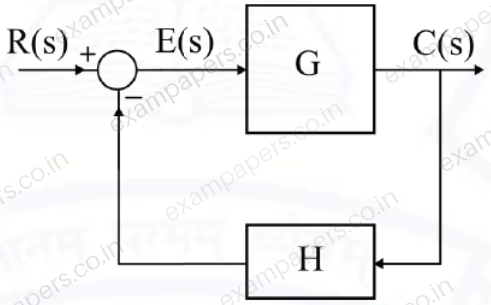
Your answerChoose one option.
Log in to check the answer
You can attempt this question now. Sign in to view the answer key, explanations and discussion.Log in to check answerQuestion 20
Open questionEENAT1 markNeeds review
The Bode magnitude plot for the transfer function
of the circuit is as shown. The value of R is ________ Ω. (Round off to 2 decimal places.) 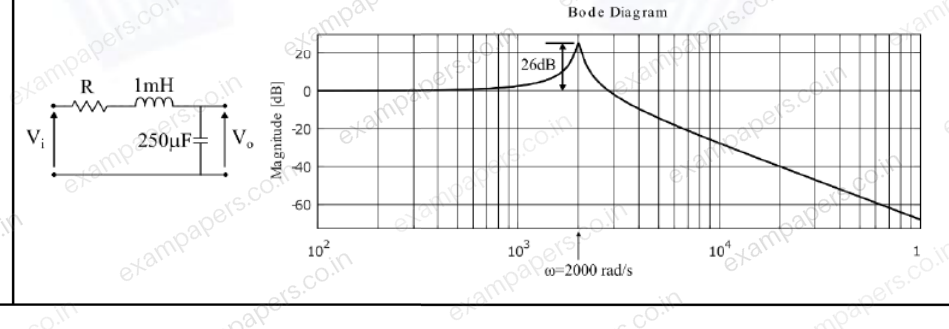
Log in to check the answer
You can attempt this question now. Sign in to view the answer key, explanations and discussion.Log in to check answer