
Environmental Science and Engineering
GATE ES concept:pie-charts PYQs
Build your understanding with focused practice from past exam papers.
How to practice concept:pie-charts
Attempt a question, record the concept and assumptions, then check the available answer. Rework mistakes after revising the relevant concepts. Topic tags can overlap; review the question context.
Questions 1–1 of 1. Imported answers require independent review unless marked reviewed.
Question 5
Open questionGAMCQ1 markNeeds review
In an election, the share of valid votes received by the four candidates A, B, C, and D is represented by the pie chart shown. The total number of votes cast in the election were 1,15,000, out of which 5,000 were invalid.
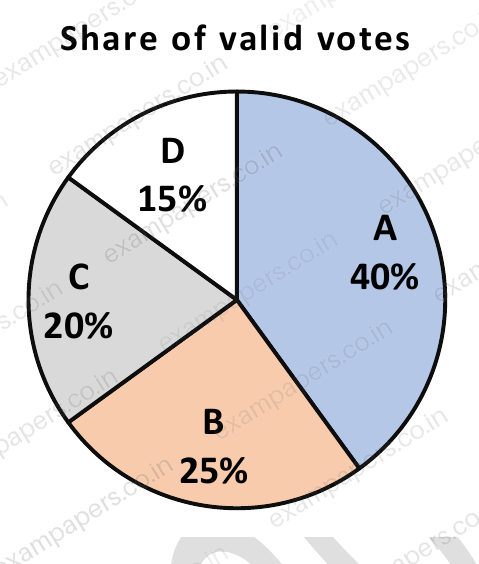
Based on the data provided, the total number of valid votes received by the candidates B and C is
Your answerChoose one option.
Log in to check the answer
You can attempt this question now. Sign in to view the answer key, explanations and discussion.Log in to check answer