
Engineering Sciences
GATE XE Polymer rheology PYQs
Build your understanding with focused practice from past exam papers.
Questions 21–27 of 27. Imported answers require independent review unless marked reviewed.
Question 15
Open questionXE-FMCQ2 marksNeeds review
A plot of strain (%) versus time of a polymer is given below. Based on this plot and the properties as mentioned below, find out the correct combination.
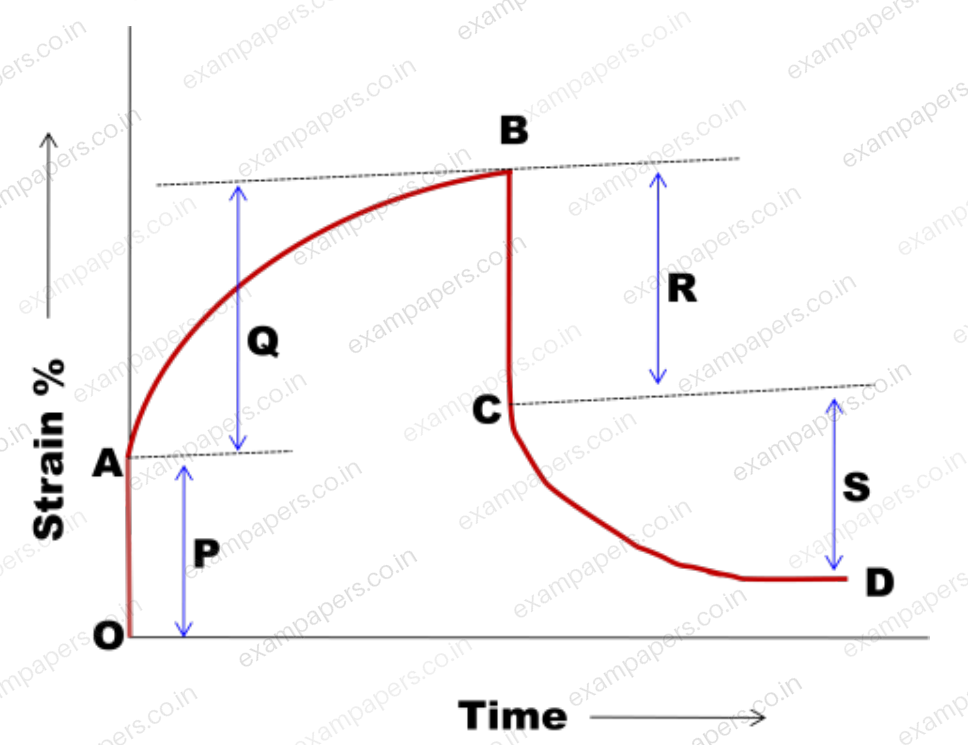
1 = Viscoelastic deformation; 2 = Elastic deformation
3 = Viscoelastic recovery; 4 = Elastic recovery
Your answerChoose one option.
Log in to check the answer
You can attempt this question now. Sign in to view the answer key, explanations and discussion.Log in to check answerQuestion 16
Open questionXE-FMCQ2 marksNeeds review
The plot shows apparent viscosity versus shear rate of Newtonian, Dilent and Pseudoplastic fluids. Based on this plot and the fluid behavior as mentioned below, find out the correct combination.
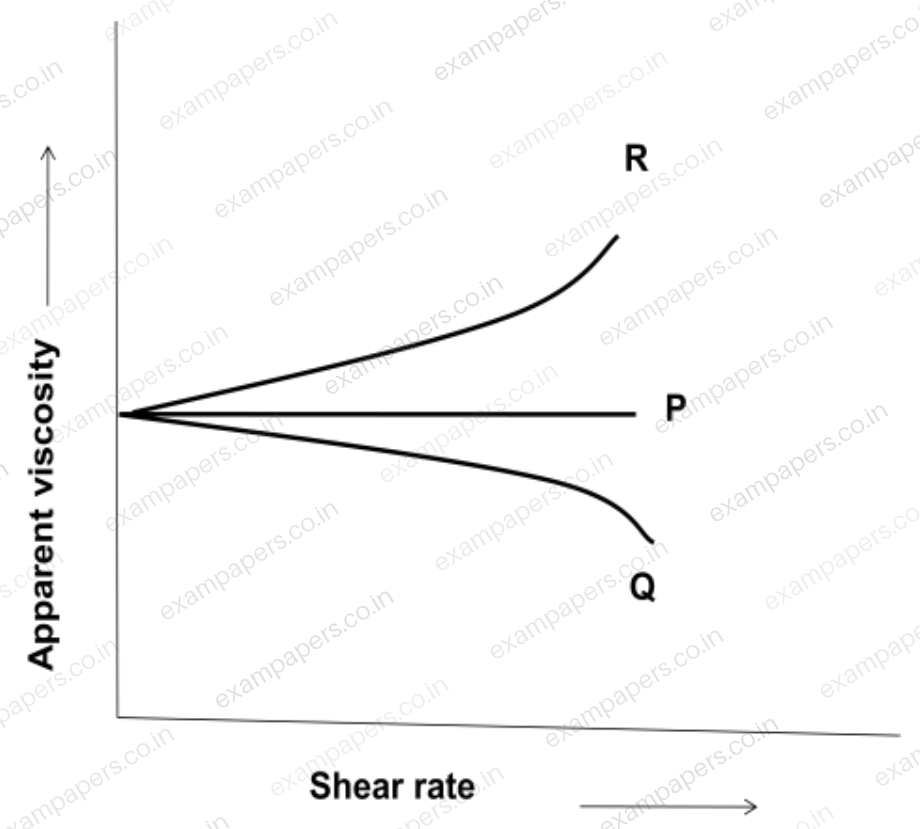
1 = Dilent fluid; 2 = Newtonian fluid; 3 = Pseudoplastic fluid
Your answerChoose one option.
Log in to check the answer
You can attempt this question now. Sign in to view the answer key, explanations and discussion.Log in to check answerQuestion 108
Open questionXE-FMCQ1 markNeeds review
The unit of viscosity of a polymer is expressed as
Your answerChoose one option.
Log in to check the answer
You can attempt this question now. Sign in to view the answer key, explanations and discussion.Log in to check answerQuestion 118
Open questionXE-FNAT2 marksNeeds review
The relaxation time for a rubber band at 23 °C is 60 days. If it is stressed to 2 MPa initially, then the time required before the stress relaxes to 1 MPa is ______ days (round off final answer to two digits after decimal point).
Log in to check the answer
You can attempt this question now. Sign in to view the answer key, explanations and discussion.Log in to check answerQuestion 119
Open questionXE-FMCQ2 marksNeeds review
Match the processing technique in Column A to the corresponding shear rate (s⁻¹) in Column B:
Column A
P. Injection Molding
Q. Extrusion
R. Calendering
S. Compression Molding
Column B
1-10
10-100
100-1000
1000-10000
Your answerChoose one option.
Log in to check the answer
You can attempt this question now. Sign in to view the answer key, explanations and discussion.Log in to check answerQuestion 121
Open questionXE-FMCQ2 marksNeeds review
Match plots 1-4 given in the figure below with the correct flow behavior of polymeric fluid listed as P, Q, R & S:
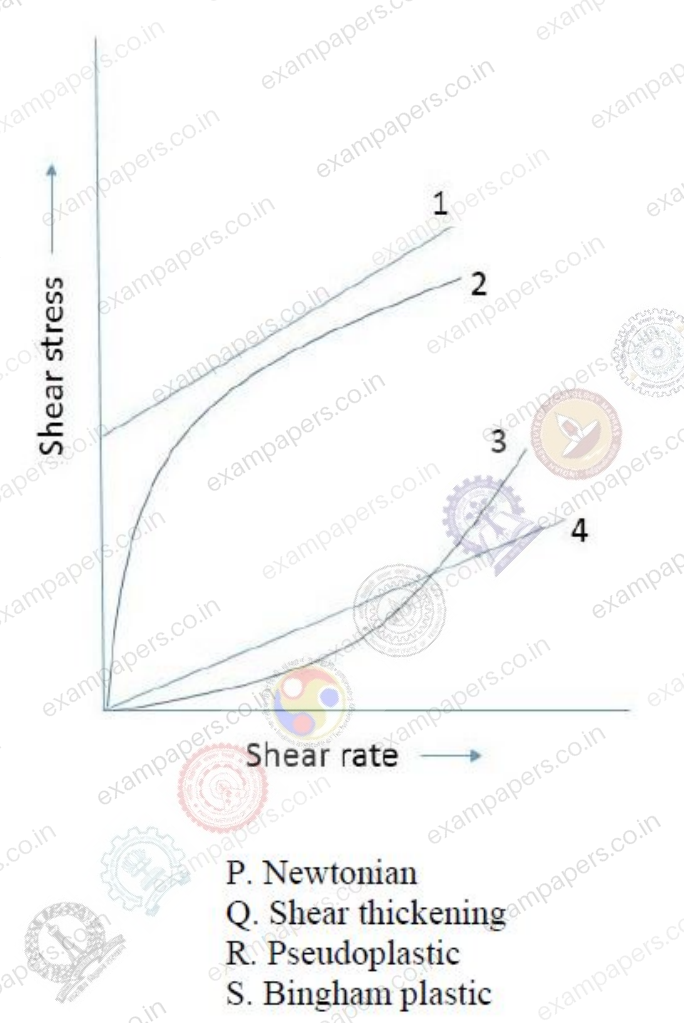
P. Newtonian
Q. Shear thickening
R. Pseudoplastic
S. Bingham plastic
Your answerChoose one option.
Log in to check the answer
You can attempt this question now. Sign in to view the answer key, explanations and discussion.Log in to check answerQuestion 135
Open questionXE-GMCQ2 marksNeeds review
Refer the shear stress – shear rate plot shown in the figure below. Match the lines (Column I) with appropriate rheological behavior (Column II).
Column I: P. Line 1; Q. Line 2; R. Line 3; S. Line 4.
Column II: 1. Dilatant; 2. Newtonian; 3. Pseudoplastic; 4. Bingham plastic
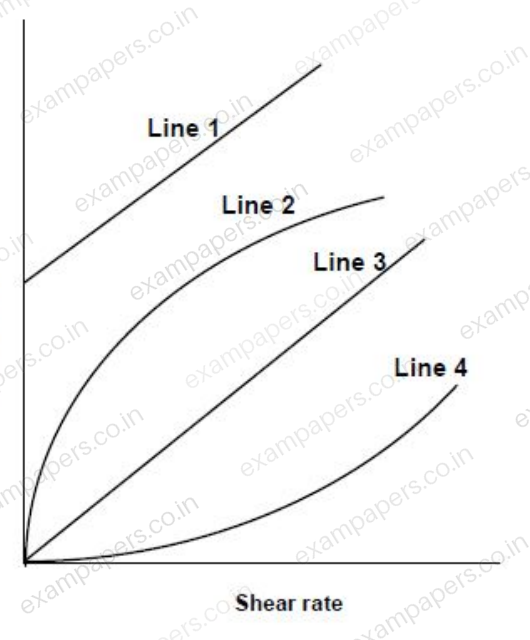
Your answerChoose one option.
Log in to check the answer
You can attempt this question now. Sign in to view the answer key, explanations and discussion.Log in to check answer