
Engineering Sciences
GATE XE year:2024 PYQs
Build your understanding with focused practice from past exam papers.
Questions 51–60 of 175. Imported answers require independent review unless marked reviewed.
Question 51
Open questionXE-CMSQ1 markNeeds review
In thermogravimetric analysis (TGA), weight change of a material sample during decomposition with temperature is shown in the figure below.
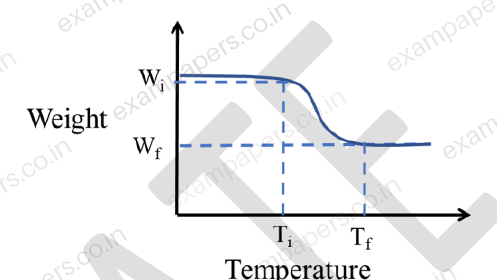
and
represent the weight of the material, corresponding to temperatures
and
, respectively. Which of the following factor(s) can influence
and
?Your answerSelect all correct options. You can choose more than one.
Log in to check the answer
You can attempt this question now. Sign in to view the answer key, explanations and discussion.Log in to check answerQuestion 52
Open questionXE-CNAT1 markNeeds review
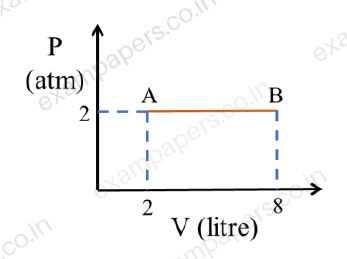
The work done by a body expanding from an initial state A to the final state B, as shown in the P-V diagram below, is (in units of litre-atm) __________ (rounded off to nearest integer).
Log in to check the answer
You can attempt this question now. Sign in to view the answer key, explanations and discussion.Log in to check answerQuestion 53
Open questionXE-CMCQ2 marksNeeds review
A binary phase diagram is given below.
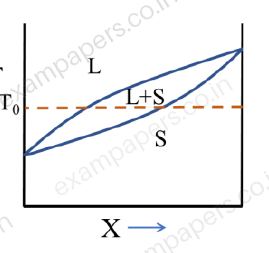
Which one of the following figures qualitatively represents the G-X (Gibbs free energy – composition) plot at temperature
shown in the phase diagram?Your answerChoose one option.
Log in to check the answer
You can attempt this question now. Sign in to view the answer key, explanations and discussion.Log in to check answerQuestion 54
Open questionXE-CMCQ2 marksNeeds review
Which one of the following figures corresponds to the density of states
of a typical intrinsic semiconductor? (
represents the energy level of a charge carrier)Your answerChoose one option.
Log in to check the answer
You can attempt this question now. Sign in to view the answer key, explanations and discussion.Log in to check answerQuestion 55
Open questionXE-CMCQ2 marksNeeds review
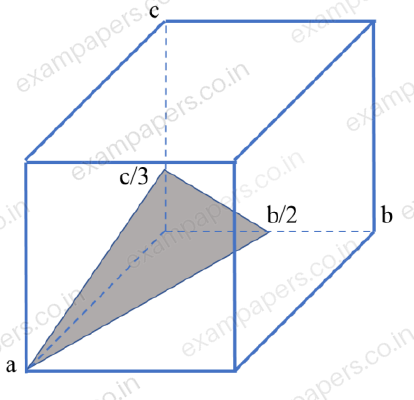
The Miller indices for the shaded plane shown in the unit cell below is
Your answerChoose one option.
Log in to check the answer
You can attempt this question now. Sign in to view the answer key, explanations and discussion.Log in to check answerQuestion 56
Open questionXE-CMCQ2 marksNeeds review
Which one of the following curves best represents the E vs.
behavior of the hot end of a metal rod demonstrating Seebeck Effect? (
is the probability of electron occupancy at an energy state
;
is the Fermi energy)Your answerChoose one option.
Log in to check the answer
You can attempt this question now. Sign in to view the answer key, explanations and discussion.Log in to check answerQuestion 57
Open questionXE-CMSQ2 marksNeeds review
In a typical light emitting diode (LED), which of the following type(s) of materials is/are used?
Your answerSelect all correct options. You can choose more than one.
Log in to check the answer
You can attempt this question now. Sign in to view the answer key, explanations and discussion.Log in to check answerQuestion 58
Open questionXE-CMSQ2 marksNeeds review
Which of the following options is/are true for glass transition temperature T_g?
Your answerSelect all correct options. You can choose more than one.
Log in to check the answer
You can attempt this question now. Sign in to view the answer key, explanations and discussion.Log in to check answerQuestion 59
Open questionXE-CMSQ2 marksNeeds review
Which of the following figures schematically represent(s) either the Frenkel defect or the Schottky defect in ionic solids?
Your answerSelect all correct options. You can choose more than one.
Log in to check the answer
You can attempt this question now. Sign in to view the answer key, explanations and discussion.Log in to check answerQuestion 60
Open questionXE-CMSQ2 marksNeeds review
Given that k is the first order reaction rate constant and T is the temperature in absolute scale, the temperature dependence of rate constant is/are represented by
Your answerSelect all correct options. You can choose more than one.
Log in to check the answer
You can attempt this question now. Sign in to view the answer key, explanations and discussion.Log in to check answer