
Humanities and Social Sciences (Psychology)
GATE XH-C5 Quantitative Aptitude PYQs
Build your understanding with focused practice from past exam papers.
Questions 31–35 of 35. Imported answers require independent review unless marked reviewed.
Question 8
Open questionGAMCQ2 marksNeeds review
Consider the following inequalities.
(i)
(ii)
Which one of the following expressions below satisfies the above two inequalities?
Your answerChoose one option.
Log in to check the answer
You can attempt this question now. Sign in to view the answer key, explanations and discussion.Log in to check answerQuestion 3
Open questionGAMCQ1 markNeeds review
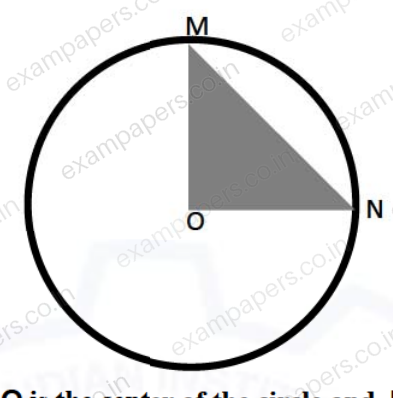
In the above figure, O is the center of the circle and M and N lie on the circle.
The area of the right triangle MON is 50 cm².
What is the area of the circle in cm²?
Your answerChoose one option.
Log in to check the answer
You can attempt this question now. Sign in to view the answer key, explanations and discussion.Log in to check answerQuestion 4
Open questionGAMCQ1 markNeeds review
If
“⊕” means “−”,
“⊗” means “÷”,
“△” means “+”,
“▽” means “×”,
then, the value of the expression △ 2 ⊕ 3 △ ((4 ⊗ 2) ▽ 4) =
Your answerChoose one option.
Log in to check the answer
You can attempt this question now. Sign in to view the answer key, explanations and discussion.Log in to check answerQuestion 8
Open questionGAMCQ2 marksNeeds review
The number of hens, ducks and goats in farm P are 65, 91 and 169, respectively. The total number of hens, ducks and goats in a nearby farm Q is 416. The ratio of hens:ducks:goats in farm Q is 5:14:13. All the hens, ducks and goats are sent from farm Q to farm P.
The new ratio of hens:ducks:goats in farm P is_____
Your answerChoose one option.
Log in to check the answer
You can attempt this question now. Sign in to view the answer key, explanations and discussion.Log in to check answerQuestion 9
Open questionGAMCQ2 marksNeeds review
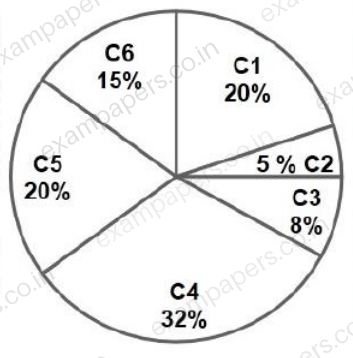
The distribution of employees at the rank of executives, across different companies C1, C2, ..., C6 is presented in the chart given above. The ratio of executives with a management degree to those without a management degree in each of these companies is provided in the table above. The total number of executives across all companies is 10,000.
The total number of management degree holders among the executives in companies C2 and C5 together is_____.
Company | Ratio |
|---|---|
C1 | 3:2 |
C2 | 1:4 |
C3 | 5:3 |
C4 | 2:3 |
C5 | 9:1 |
C6 | 3:4 |
Your answerChoose one option.
Log in to check the answer
You can attempt this question now. Sign in to view the answer key, explanations and discussion.Log in to check answer