
Life Sciences
GATE XL topic:spatial-aptitude PYQs
Build your understanding with focused practice from past exam papers.
Questions 11–11 of 11. Imported answers require independent review unless marked reviewed.
Question 9
Open questionGAMCQ2 marksNeeds review
Which of the following functions describe the graph shown in the below figure?
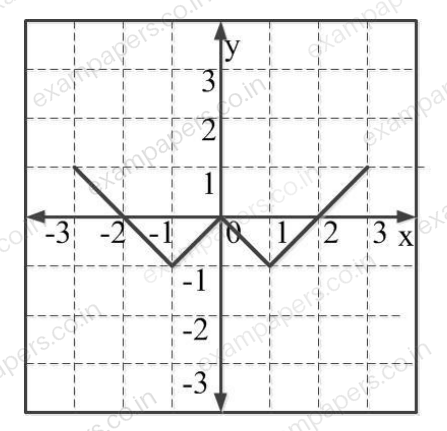
Your answerChoose one option.
Log in to check the answer
You can attempt this question now. Sign in to view the answer key, explanations and discussion.Log in to check answer