
Architecture and Planning
2018 · Paper 1
Take it one question at a time. Try an answer, then check your understanding.
Complete GATE AR 2018 Paper 1 overview, original pages and practice · Timed previous-paper practice
Questions 10–12 of 65. Imported answers require review unless explicitly marked reviewed.
Question 10
Open questionGAMCQ2 marksNeeds review
In a detailed study of annual crow births in India, it was found that there was relatively no growth during the period 2002 to 2004 and a sudden spike from 2004 to 2005. In another unrelated study, it was found that the revenue from cracker sales in India which remained fairly flat from 2002 to 2004, saw a sudden spike in 2005 before declining again in 2006. The solid line in the graph below refers to annual sale of crackers and the dashed line refers to the annual crow births in India.
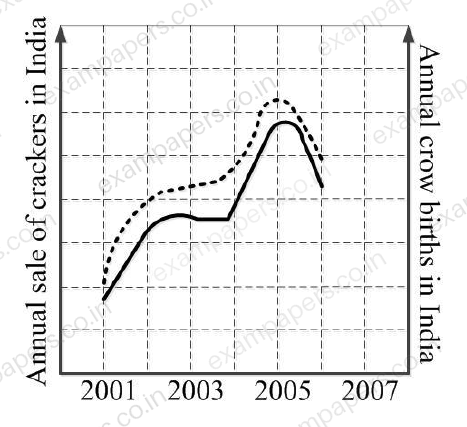
Choose the most appropriate inference from the above data.
Your answerChoose one option.
Log in to check the answer
You can attempt this question now. Sign in to view the answer key, explanations and discussion.Log in to check answerQuestion 1
Open questionARMCQ1 markNeeds review
In a Colour Wheel, Red and Blue colours are
Your answerChoose one option.
Log in to check the answer
You can attempt this question now. Sign in to view the answer key, explanations and discussion.Log in to check answerQuestion 2
Open questionARMCQ1 markNeeds review
In a bird’s eye perspective view of a cubid, the maximum number of vanishing points is
Your answerChoose one option.
Log in to check the answer
You can attempt this question now. Sign in to view the answer key, explanations and discussion.Log in to check answer