
Civil Engineering
2018 · Paper 2
Take it one question at a time. Try an answer, then check your understanding.
Complete GATE CE 2018 Paper 2 overview, original pages and practice · Timed previous-paper practice
Questions 25–27 of 65. Imported answers require review unless explicitly marked reviewed.
Question 15
Open questionCEMCQ1 markNeeds review
In the figures, Group I represents the atmospheric temperature profiles (P, Q, R and S) and Group II represents dispersion of pollutants from a smoke stack (1, 2, 3 and 4). In the figures of Group I, the dashed line represents the dry adiabatic lapse rate, where the horizontal axis represents temperature and the vertical axis represents the altitude.
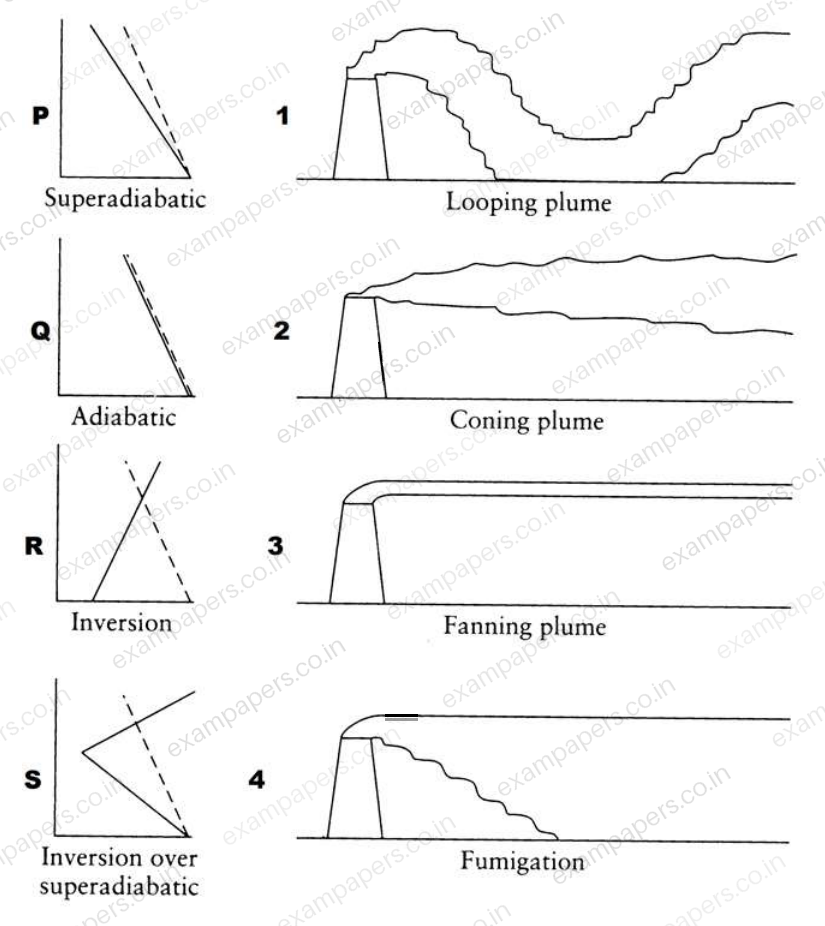
The correct match is
Your answerChoose one option.
Log in to check the answer
You can attempt this question now. Sign in to view the answer key, explanations and discussion.Log in to check answerQuestion 16
Open questionCEMCQ1 markNeeds review
Peak Hour Factor (PHF) is used to represent the proportion of peak sub-hourly traffic flow within the peak hour. If 15-minute sub-hours are considered, the theoretical possible range of PHF will be
Your answerChoose one option.
Log in to check the answer
You can attempt this question now. Sign in to view the answer key, explanations and discussion.Log in to check answerQuestion 17
Open questionCEMCQ1 markNeeds review
As per IRC:37-2012, in order to control subgrade ruting in flexible pavements, the parameter to be considered is
Your answerChoose one option.
Log in to check the answer
You can attempt this question now. Sign in to view the answer key, explanations and discussion.Log in to check answer