
GATE CY · 2018 · GA
Question 10: Quantitative Aptitude
Give it a try, then reveal the answer to check your work.
Question 10
GAMCQ2 marksNeeds review
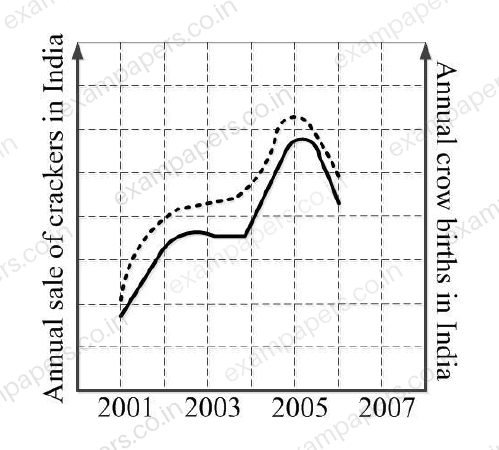
In a detailed study of annual crow births in India, it was found that there was relatively no growth during the period 2002 to 2004 and a sudden spike from 2004 to 2005. In another unrelated study, it was found that the revenue from cracker sales in India which remained fairly flat from 2002 to 2004, saw a sudden spike in 2005 before declining again in 2006. The solid line in the graph below refers to annual sale of crackers and the dashed line refers to the annual crow births in India. Choose the most appropriate inference from the above data.
Your answerChoose one option.
Log in to check the answer
You can attempt this question now. Sign in to view the answer key, explanations and discussion.Log in to check answerEXPLORE & PRACTISE
Paper and topic context
See where this question comes from and choose what to practise next.
2018GA
GATE CY 2018 · Paper 1
Chemistry · Original paper archive
- Section
- General Aptitude
- Question type
- Multiple choice (MCQ)
- Marks
- 2 marks
Practise related topics
Explore more previous year questions using this question’s imported topic tags.
chemistry
GATE CY previous year questions
chemical sciences
GATE CY previous year questions
chemical reactions
GATE CY previous year questions
quantitative aptitude
GATE CY previous year questions
Comments
Ask a question, share your approach, or help someone understand.
Log in to view the discussion
You’re not logged in. Log in or create an account to see discussions and add comments.