
GATE PI · 2020 · PI
Question 32: Product Design and Development
Give it a try, then reveal the answer to check your work.
Question 32
PIMCQ2 marksNeeds review
The figure shows revenue generated over different product life cycle stages marked as P, Q, R and S. Group I lists these product life cycle stages. Group II lists typical efforts leading to revenue maximization during a stage.
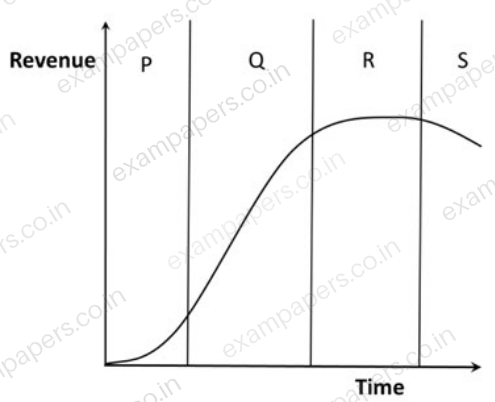
Group I
P. Introduction
Q. Growth
R. Maturity
S. Decline
Group II
Efforts to enhance the production capacity
Efforts to rejuvenate the product
Efforts to maximize the product performance
Efforts to explore other markets
Match the stage with the efforts.
Your answerChoose one option.
Log in to check the answer
You can attempt this question now. Sign in to view the answer key, explanations and discussion.Log in to check answerEXPLORE & PRACTISE
Paper and topic context
See where this question comes from and choose what to practise next.
2020PI
GATE PI 2020 · Paper 1
Production and Industrial Engineering · Original paper archive
- Section
- Production and Industrial Engineering
- Question type
- Multiple choice (MCQ)
- Marks
- 2 marks
Practise related topics
Explore more previous year questions using this question’s imported topic tags.
production engineering
GATE PI previous year questions
industrial engineering
GATE PI previous year questions
manufacturing
GATE PI previous year questions
product design development
GATE PI previous year questions
Product Design and Development
GATE PI previous year questions
product life cycle
GATE PI previous year questions
Comments
Ask a question, share your approach, or help someone understand.
Log in to view the discussion
You’re not logged in. Log in or create an account to see discussions and add comments.