
GATE GG-1 · 2020 · GA
Question 10: Quantitative Aptitude
Give it a try, then reveal the answer to check your work.
Question 10
GAMCQ2 marksNeeds review
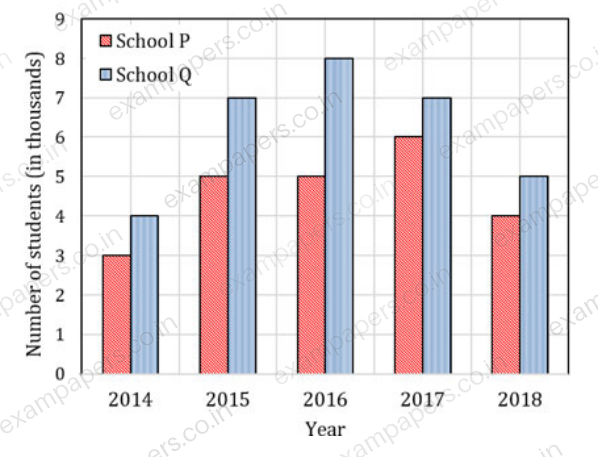
The following figure shows the data of students enrolled in 5 years (2014 to 2018) for two schools P and Q. During this period, the ratio of the average number of the students enrolled in school P to the average of the difference of the number of students enrolled in schools P and Q is ______.
Your answerChoose one option.
Log in to check the answer
You can attempt this question now. Sign in to view the answer key, explanations and discussion.Log in to check answerEXPLORE & PRACTISE
Paper and topic context
See where this question comes from and choose what to practise next.
2020GA
GATE GG-1 2020 · Paper 1
Geology and Geophysics · Original paper archive
- Section
- General Aptitude
- Question type
- Multiple choice (MCQ)
- Marks
- 2 marks
Practise related topics
Explore more previous year questions using this question’s imported topic tags.
geology
GATE GG-1 previous year questions
earth science
GATE GG-1 previous year questions
geoscience
GATE GG-1 previous year questions
quantitative aptitude
GATE GG-1 previous year questions
Comments
Ask a question, share your approach, or help someone understand.
Log in to view the discussion
You’re not logged in. Log in or create an account to see discussions and add comments.