
GATE CE · 2018 · CE
Question 2: Probability and Statistics
Give it a try, then reveal the answer to check your work.
Question 2
CEMCQ1 markNeeds review
The graph of a function
is shown in the figure. For
to be a valid probability density function, the value of
is 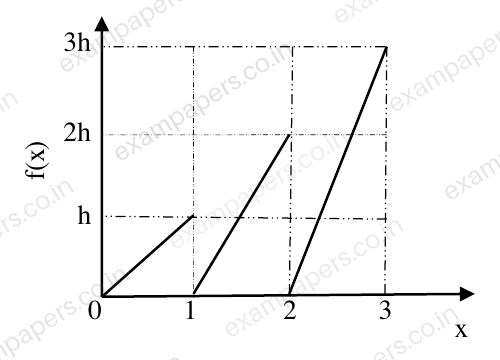
Your answerChoose one option.
Log in to check the answer
You can attempt this question now. Sign in to view the answer key, explanations and discussion.Log in to check answerEXPLORE & PRACTISE
Paper and topic context
See where this question comes from and choose what to practise next.
2018CE
GATE CE 2018 · Paper 2
Civil Engineering · Original paper archive
- Section
- Civil Engineering
- Question type
- Multiple choice (MCQ)
- Marks
- 1 mark
Practise related topics
Explore more previous year questions using this question’s imported topic tags.
civil engineering
GATE CE previous year questions
infrastructure
GATE CE previous year questions
structural engineering
GATE CE previous year questions
probability and statistics
GATE CE previous year questions
Comments
Ask a question, share your approach, or help someone understand.
Log in to view the discussion
You’re not logged in. Log in or create an account to see discussions and add comments.