
GATE XL · 2024 · GA
Question 8: Quantitative Aptitude
Give it a try, then reveal the answer to check your work.
Question 8
GAMCQ2 marksNeeds review
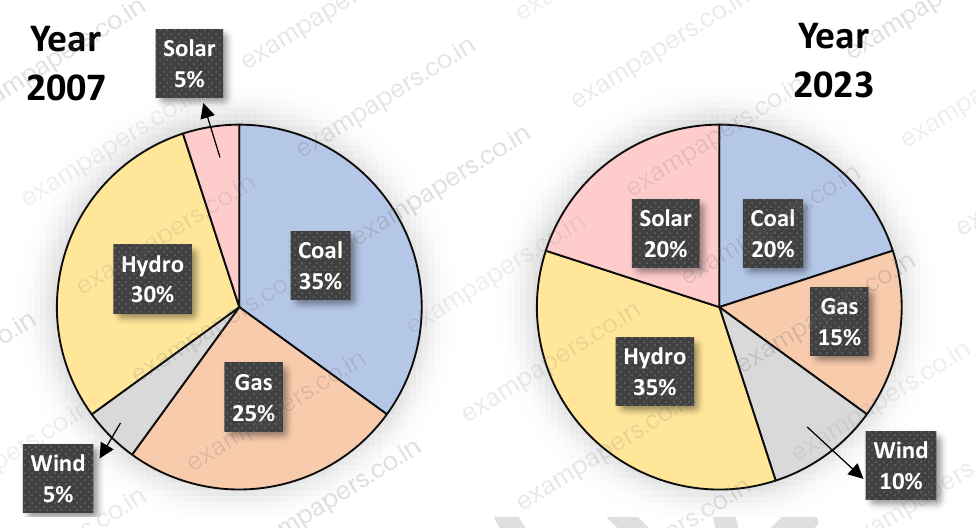
The pie charts depict the shares of various power generation technologies in the total electricity generation of a country for the years 2007 and 2023.
[Pie charts: Year 2007 — Coal 35%, Gas 25%, Hydro 30%, Solar 5%, Wind 5%; Year 2023 — Coal 20%, Gas 15%, Hydro 35%, Solar 20%, Wind 10%.]
The renewable sources of electricity generation consist of Hydro, Solar and Wind. Assuming that the total electricity generated remains the same from 2007 to 2023, what is the percentage increase in the share of the renewable sources of electricity generation over this period?
Your answerChoose one option.
Log in to check the answer
You can attempt this question now. Sign in to view the answer key, explanations and discussion.Log in to check answerEXPLORE & PRACTISE
Paper and topic context
See where this question comes from and choose what to practise next.
2024GA
GATE XL 2024 · Paper 1
Life Sciences · Original paper archive
- Section
- General Aptitude
- Question type
- Multiple choice (MCQ)
- Marks
- 2 marks
Practise related topics
Explore more previous year questions using this question’s imported topic tags.
life sciences
GATE XL previous year questions
biology
GATE XL previous year questions
biological sciences
GATE XL previous year questions
quantitative aptitude
GATE XL previous year questions
pie charts
GATE XL previous year questions
Comments
Ask a question, share your approach, or help someone understand.
Log in to view the discussion
You’re not logged in. Log in or create an account to see discussions and add comments.