
Civil Engineering
GATE CE Traffic Engineering PYQs
Build your understanding with focused practice from past exam papers.
Questions 21–30 of 44. Imported answers require independent review unless marked reviewed.
Question 65
Open questionCENAT2 marksNeeds review
The lane configuration with lane volumes in vehicles per hour of a four-arm signalized intersection is shown in the figure. There are only two phases: the first phase is for the East-West and the West-East through movements, and the second phase is for the North-South and the South-North through movements. There are no turning movements. Assume that the saturation flow is 1800 vehicles per hour per lane for each lane and the total lost time for the first and the second phases together is 9 seconds.
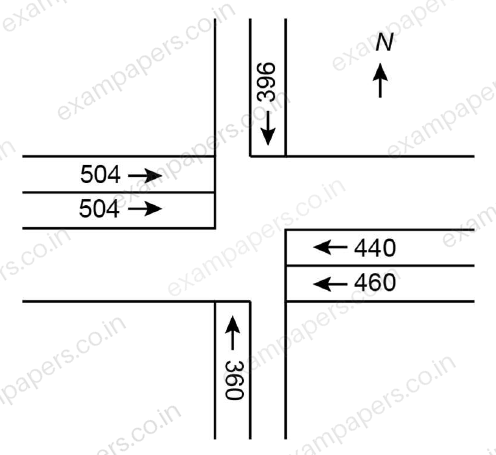
The optimum cycle length (in seconds), as per the Webster’s method, is __________. (round off to the nearest integer)
Log in to check the answer
You can attempt this question now. Sign in to view the answer key, explanations and discussion.Log in to check answerQuestion 13
Open questionCEMCQ1 markNeeds review
Relationship between trafic speed and density is described using a negatively sloped straight line. If
is the free-flow speed then the speed at which the maximum flow occurs isYour answerChoose one option.
Log in to check the answer
You can attempt this question now. Sign in to view the answer key, explanations and discussion.Log in to check answerQuestion 24
Open questionCENAT1 markNeeds review
In a three-phase signal system design for a four-leg intersection, the critical flow ratios for each phase are 0.18, 0.32, and 0.22. The total loss time in each of the phases is 2 s. As per Webster’s formula, the optimal cycle length (in s, round off to the nearest integer) is
Log in to check the answer
You can attempt this question now. Sign in to view the answer key, explanations and discussion.Log in to check answerQuestion 25
Open questionCENAT1 markNeeds review
A signalized intersection operates in two phases. The lost time is 3 seconds per phase. The maximum ratios of approach flow to saturation flow for the two phases are 0.37 and 0.40. The optimum cycle length using the Webster’s method (in seconds, round off to one decimal place) is ______.
Log in to check the answer
You can attempt this question now. Sign in to view the answer key, explanations and discussion.Log in to check answerQuestion 35
Open questionCEMCQ2 marksNeeds review
On a road, the speed – density relationship of a traffic stream is given by
(where speed,
, is in km/h and density,
, is in veh/km). At the capacity condition, the average time headway will beYour answerChoose one option.
Log in to check the answer
You can attempt this question now. Sign in to view the answer key, explanations and discussion.Log in to check answerQuestion 53
Open questionCENAT2 marksNeeds review
Spot speeds of vehicles observed at a point on a highway are 40, 55, 60, 65 and 80 km/h. The space-mean speed (in km/h, round off to two decimal places) of the observed vehicles is ________.
Log in to check the answer
You can attempt this question now. Sign in to view the answer key, explanations and discussion.Log in to check answerQuestion 9
Open questionCEMCQ1 markNeeds review
The traffic starts discharging from an approach at an intersection with the signal turning green. The constant headway considered from the fourth or fifth headway position is referred to as
Your answerChoose one option.
Log in to check the answer
You can attempt this question now. Sign in to view the answer key, explanations and discussion.Log in to check answerQuestion 21
Open questionCENAT1 markNeeds review
24-h traffic count at a road section was observed to be 1000 vehicles on a Tuesday in the month of July. If daily adjustment factor for Tuesday is 1.121 and monthly adjustment factor for July is 0.913, the Annual Average Daily Traffic (in veh/day, round off to the nearest integer) is ________.
Log in to check the answer
You can attempt this question now. Sign in to view the answer key, explanations and discussion.Log in to check answerQuestion 31
Open questionCEMCQ2 marksNeeds review
The flow-density relationship of traffic on a highway is shown in the figure
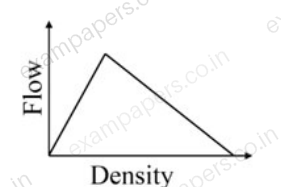
. The correct representation of speed-density relationship of the traffic on this highway is
Your answerChoose one option.
Log in to check the answer
You can attempt this question now. Sign in to view the answer key, explanations and discussion.Log in to check answerQuestion 32
Open questionCEMCQ2 marksNeeds review
The relationship between traffic flow rate (q) and density (D) is shown in the figure. The shock wave condition is depicted by
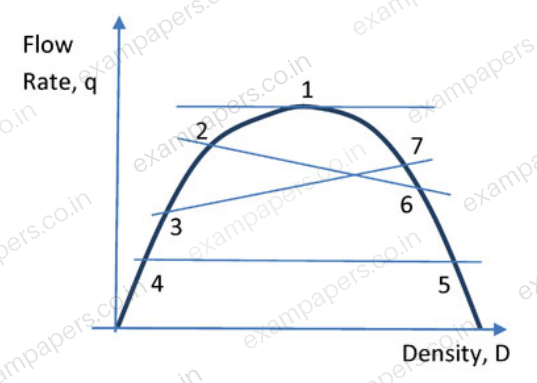
Your answerChoose one option.
Log in to check the answer
You can attempt this question now. Sign in to view the answer key, explanations and discussion.Log in to check answer