
Computer Science and Information Technology
GATE CSE concept:pie-charts PYQs
Build your understanding with focused practice from past exam papers.
How to practice concept:pie-charts
Attempt a question, record the concept and assumptions, then check the available answer. Rework mistakes after revising the relevant concepts. Topic tags can overlap; review the question context.
Questions 1–2 of 2. Imported answers require independent review unless marked reviewed.
Question 8
Open questionGAMCQ2 marksNeeds review
The pie chart presents the percentage contribution of different macronutrients to a typical 2,000 kcal diet of a person.
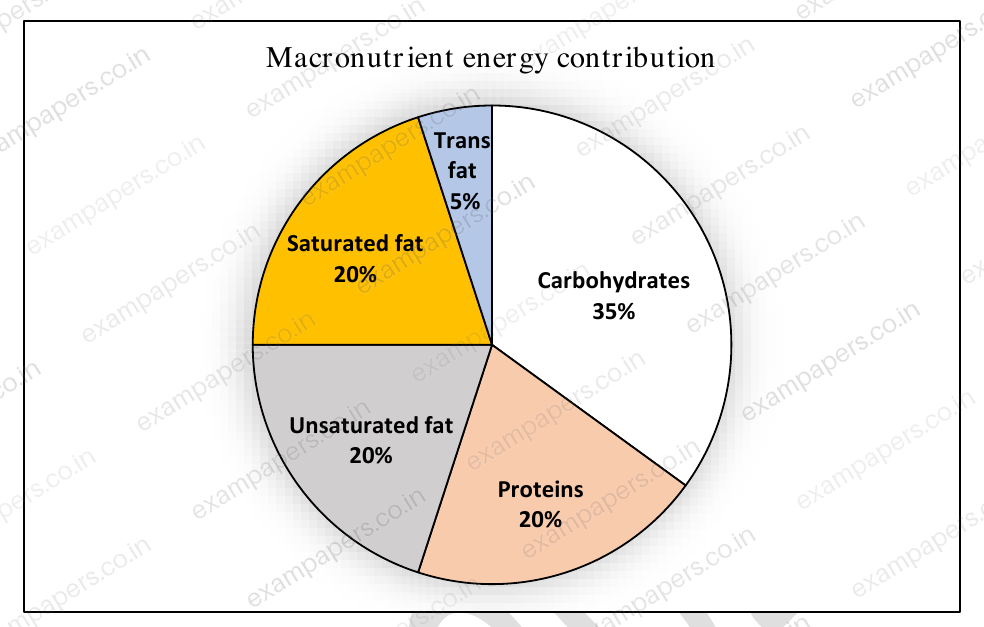
The typical energy density (kcal/g) of these macronutrients is given in the table.
Macronutrient | Energy density (kcal/g) |
|---|---|
Carbohydrates | 4 |
Proteins | 4 |
Unsaturated fat | 9 |
Saturated fat | 9 |
Trans fat | 9 |
The total fat (all three types), in grams, this person consumes is
Your answerChoose one option.
Log in to check the answer
You can attempt this question now. Sign in to view the answer key, explanations and discussion.Log in to check answerQuestion 8
Open questionGAMCQ2 marksNeeds review
The pie charts depict the shares of various power generation technologies in the total electricity generation of a country for the years 2007 and 2023.
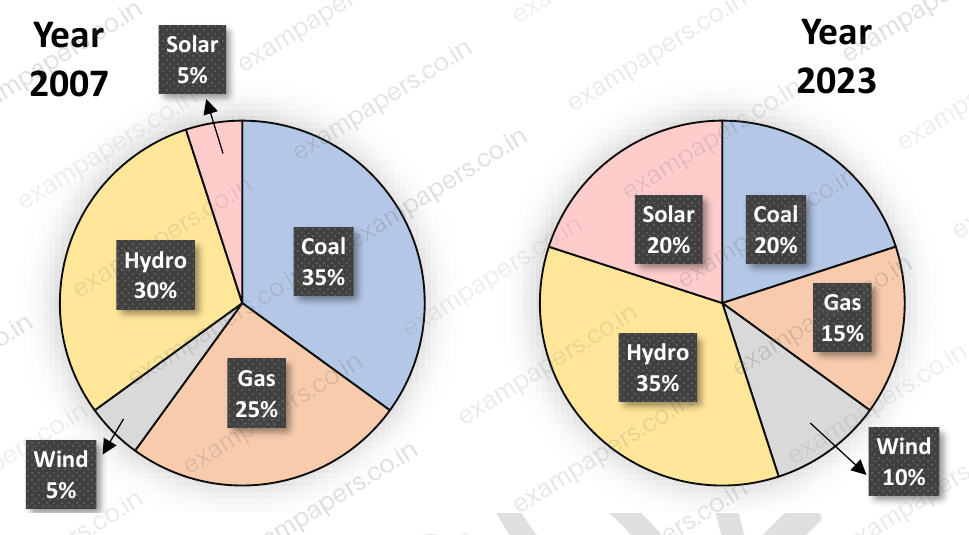
The renewable sources of electricity generation consist of Hydro, Solar and Wind. Assuming that the total electricity generated remains the same from 2007 to 2023, what is the percentage increase in the share of the renewable sources of electricity generation over this period?
Your answerChoose one option.
Log in to check the answer
You can attempt this question now. Sign in to view the answer key, explanations and discussion.Log in to check answer