
Instrumentation Engineering
GATE IN format:mcq PYQs
Build your understanding with focused practice from past exam papers.
Questions 111–120 of 360. Imported answers require independent review unless marked reviewed.
Question 38
Open questionINMCQ2 marksNeeds review
Consider a discrete-time sequence
The region of convergence of
, the z-transform of
, consists ofYour answerChoose one option.
Log in to check the answer
You can attempt this question now. Sign in to view the answer key, explanations and discussion.Log in to check answerQuestion 39
Open questionINMCQ2 marksNeeds review
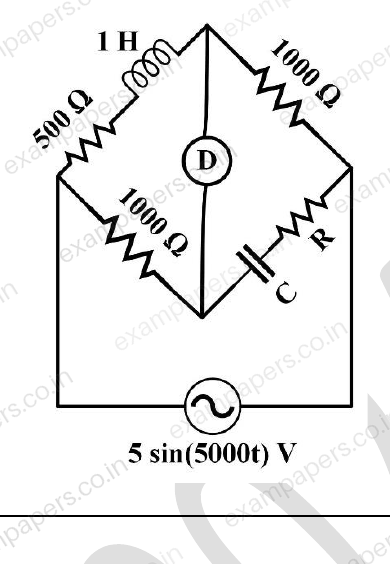
In the bridge circuit shown in the figure, under balanced condition, the values of R and C respectively, are
Your answerChoose one option.
Log in to check the answer
You can attempt this question now. Sign in to view the answer key, explanations and discussion.Log in to check answerQuestion 40
Open questionINMCQ2 marksNeeds review
Laplace transform of a signal
is
. Let
be the unit step function. Choose the signal
from the following options if the region of convergence is
.Your answerChoose one option.
Log in to check the answer
You can attempt this question now. Sign in to view the answer key, explanations and discussion.Log in to check answerQuestion 41
Open questionINMCQ2 marksNeeds review
In the figure shown, both the opamps A₁ and A₂ are ideal, except that the opamp A₁ has an offset voltage (
) of 1 mV. For
V, the values of the output voltages
and
, respectively, are 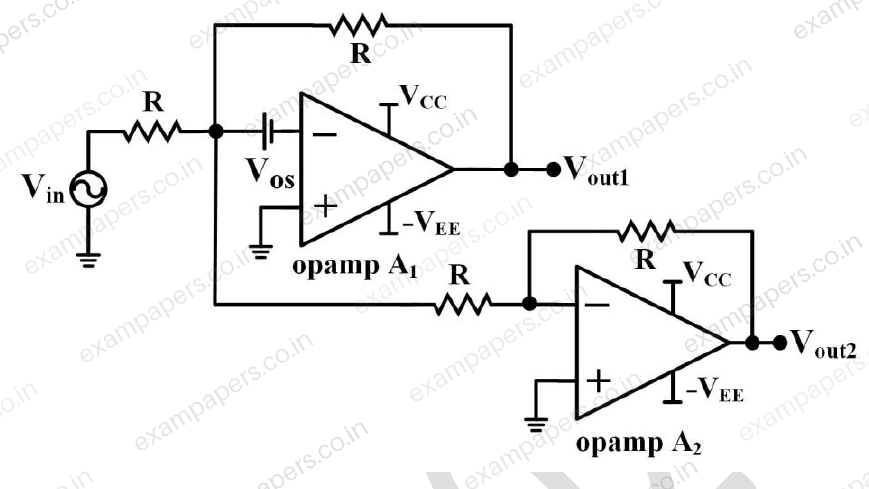
Your answerChoose one option.
Log in to check the answer
You can attempt this question now. Sign in to view the answer key, explanations and discussion.Log in to check answerQuestion 42
Open questionINMCQ2 marksNeeds review
In the figure shown, the positive edge triggered D flip-flops are initially reset to Q = 0. The logic gates and the multiplexers have no propagation delay. After reset, a train of clock pulses (CLK) are applied. The logic states of the inputs DIN, S and the clock pulses are also shown in the figure. Assuming no timing violations, the sequence of output Y from the 3rd clock to the 5th clock,
is 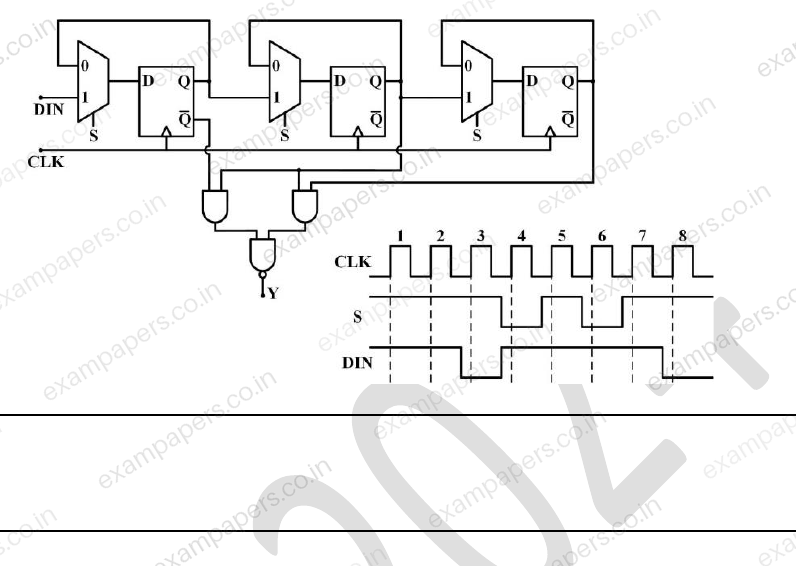
Your answerChoose one option.
Log in to check the answer
You can attempt this question now. Sign in to view the answer key, explanations and discussion.Log in to check answerQuestion 43
Open questionINMCQ2 marksNeeds review
In the figure shown, R = 1 kΩ and C = 0.1 μF. For a dc gain of −10, the 3 dB cut-off frequency (rounded off to one decimal place) is
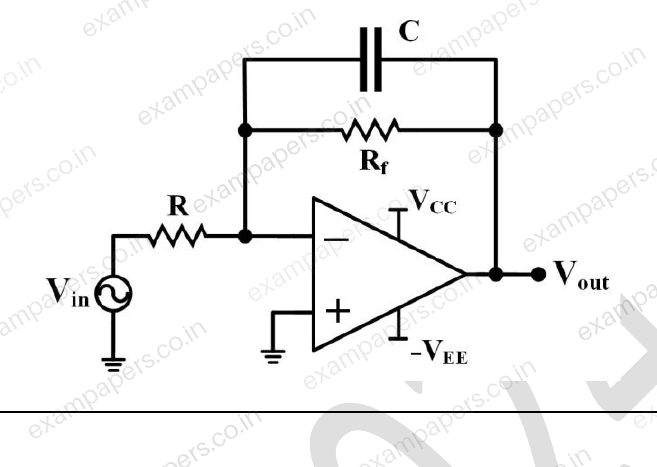
Assume the opamp is ideal.
Your answerChoose one option.
Log in to check the answer
You can attempt this question now. Sign in to view the answer key, explanations and discussion.Log in to check answerQuestion 44
Open questionINMCQ2 marksNeeds review
Consider the feedback control system shown in the figure. The steady-state error
due to unit step reference
is 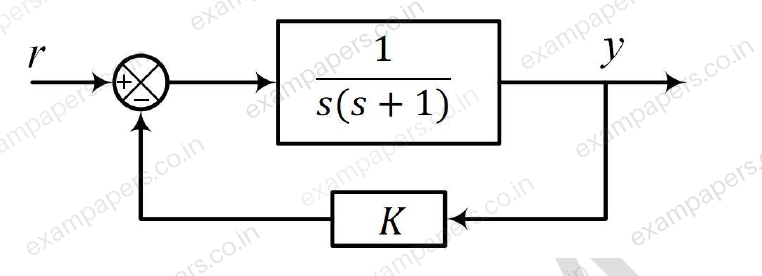
Your answerChoose one option.
Log in to check the answer
You can attempt this question now. Sign in to view the answer key, explanations and discussion.Log in to check answerQuestion 45
Open questionINMCQ2 marksNeeds review
The transfer function of a system is
Choose the range of
and
(in rad/s) from the following options such that the poles lie on the shaded region of the
-plane as shown in the figure. 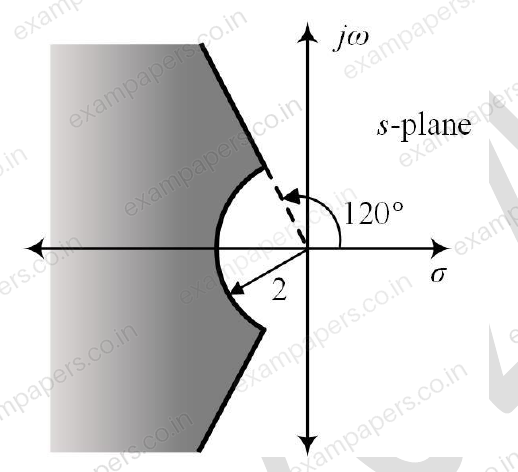
Your answerChoose one option.
Log in to check the answer
You can attempt this question now. Sign in to view the answer key, explanations and discussion.Log in to check answerQuestion 46
Open questionINMCQ2 marksNeeds review
Let
be the closed curve in the
-plane, traversed in the counterclockwise direction along the boundary of the rectangle with vertices at
,
,
,
. The value of the line integral
isYour answerChoose one option.
Log in to check the answer
You can attempt this question now. Sign in to view the answer key, explanations and discussion.Log in to check answerQuestion 47
Open questionINMCQ2 marksNeeds review
In the figure shown, assume
is the phase angle between the load current and the load voltage
is the phase angle by which pressure coil current lags the pressure coil voltage of the wattmeter
is the phase angle between currents in the pressure coil and the current coil of the wattmeter
is the phase angle of the voltage transformer
is the phase angle of the current transformerWhen the load has a lagging phase angle of
, which one of the following options is correct? 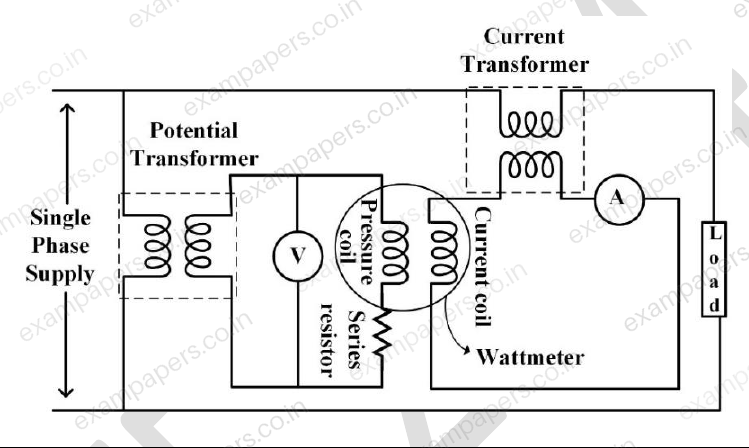
Your answerChoose one option.
Log in to check the answer
You can attempt this question now. Sign in to view the answer key, explanations and discussion.Log in to check answer