
Metallurgical Engineering
2024 · Paper 1
Take it one question at a time. Try an answer, then check your understanding.
Complete GATE MT 2024 Paper 1 overview, original pages and practice · Timed previous-paper practice
Questions 13–15 of 65. Imported answers require review unless explicitly marked reviewed.
Question 13
Open questionMTMCQ1 markNeeds review
Consider the normal (Gaussian) distributions
,
,
shown in the figure.
and
are the standard deviation and mean of distribution
, respectively, and the means are positive. Which one of the following deductions is correct? 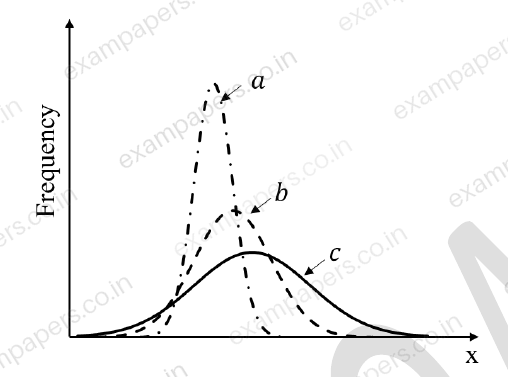
Your answerChoose one option.
Log in to check the answer
You can attempt this question now. Sign in to view the answer key, explanations and discussion.Log in to check answerQuestion 14
Open questionMTMCQ1 markNeeds review
If in an A-B solid solution, the activity and mole fraction of A are given by
and
, respectively, then the activity coefficient of A is given byYour answerChoose one option.
Log in to check the answer
You can attempt this question now. Sign in to view the answer key, explanations and discussion.Log in to check answerQuestion 15
Open questionMTMCQ1 markNeeds review
As shown in the figure, two rods of different metals of equal lengths,
, diameter
(
), and constant thermal conductivities
and
(with
) are connected perfectly (i.e., zero interface thermal resistance). The left and right ends of the connected rod are maintained at temperatures
and
(
). Assume that the rods are insulated from the environment, apart from the two flat ends. Which one of the following graphs represents the temperature distribution at steady-state? The thick line shows the temperature profile. The horizontal axis shows the distance from the left end of the rod to the right and the vertical axis denotes temperature. 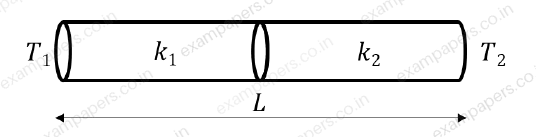
Your answerChoose one option.
Log in to check the answer
You can attempt this question now. Sign in to view the answer key, explanations and discussion.Log in to check answer