
GATE MT · 2024 · MT
Question 15: Heat transfer
Give it a try, then reveal the answer to check your work.
Question 15
MTMCQ1 markNeeds review
As shown in the figure, two rods of different metals of equal lengths,
, diameter
(
), and constant thermal conductivities
and
(with
) are connected perfectly (i.e., zero interface thermal resistance). The left and right ends of the connected rod are maintained at temperatures
and
(
). Assume that the rods are insulated from the environment, apart from the two flat ends. Which one of the following graphs represents the temperature distribution at steady-state? The thick line shows the temperature profile. The horizontal axis shows the distance from the left end of the rod to the right and the vertical axis denotes temperature. 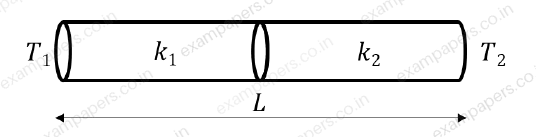
Your answerChoose one option.
Log in to check the answer
You can attempt this question now. Sign in to view the answer key, explanations and discussion.Log in to check answerEXPLORE & PRACTISE
Paper and topic context
See where this question comes from and choose what to practise next.
2024MT
GATE MT 2024 · Paper 1
Metallurgical Engineering · Original paper archive
- Section
- Metallurgical Engineering
- Question type
- Multiple choice (MCQ)
- Marks
- 1 mark
Practise related topics
Explore more previous year questions using this question’s imported topic tags.
metallurgy
GATE MT previous year questions
materials science
GATE MT previous year questions
materials engineering
GATE MT previous year questions
heat transfer
GATE MT previous year questions
Comments
Ask a question, share your approach, or help someone understand.
Log in to view the discussion
You’re not logged in. Log in or create an account to see discussions and add comments.