
GATE XL · 2026 · XL-T
Question 101: Ecology
Give it a try, then reveal the answer to check your work.
Question 101
XL-TMSQ2 marksNeeds review
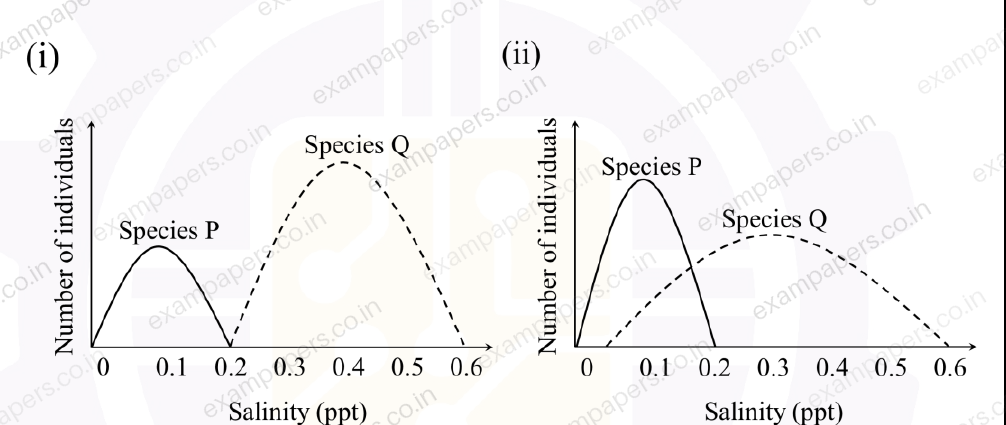
In rivers that range in salinity (ppt) from low to high, researchers find that the aquatic snail species P (solid curve) and Q (dashed curve) were distributed according to the pattern illustrated in figure (i) when the species are together. The researchers then conducted a manipulative experiment in similar rivers with the same salinity range, where they removed either species P or Q. Figure (ii) illustrates the number of individuals of species P and Q when they were allowed to live alone. These snails have no other competitors or predators. Which one or more conclusions can be drawn from these two figures?
Your answerSelect all correct options. You can choose more than one.
Log in to check the answer
You can attempt this question now. Sign in to view the answer key, explanations and discussion.Log in to check answerEXPLORE & PRACTISE
Paper and topic context
See where this question comes from and choose what to practise next.
2026XL-T
GATE XL 2026 · Paper 1
Life Sciences · Original paper archive
- Section
- Section XL-T
- Question type
- Multiple select (MSQ)
- Marks
- 2 marks
Practise related topics
Explore more previous year questions using this question’s imported topic tags.
life sciences
GATE XL previous year questions
biology
GATE XL previous year questions
biological sciences
GATE XL previous year questions
ecology
GATE XL previous year questions
Comments
Ask a question, share your approach, or help someone understand.
Log in to view the discussion
You’re not logged in. Log in or create an account to see discussions and add comments.