
GATE XE · 2025 · XE-C
Question 55: Thermodynamics, Kinetics and Phase Transformations
Give it a try, then reveal the answer to check your work.
Question 55
XE-CMCQ2 marksNeeds review
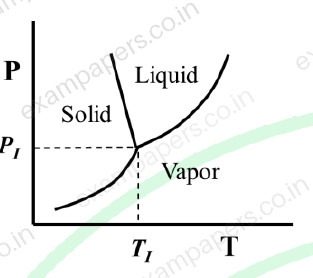
The triple point
is shown in a schematic phase diagram (pressure (P) – temperature (T) plot) for one component system.
,
and
are the free energies of solid, liquid and vapor, respectively. At a constant pressure,
, the correct free energy (G) versus temperature (T) plot is
Your answerChoose one option.
Log in to check the answer
You can attempt this question now. Sign in to view the answer key, explanations and discussion.Log in to check answerEXPLORE & PRACTISE
Paper and topic context
See where this question comes from and choose what to practise next.
2025XE-C
GATE XE 2025 · Paper 1
Engineering Sciences · Original paper archive
- Section
- Section XE-C
- Question type
- Multiple choice (MCQ)
- Marks
- 2 marks
Practise related topics
Explore more previous year questions using this question’s imported topic tags.
engineering sciences
GATE XE previous year questions
engineering
GATE XE previous year questions
applied science
GATE XE previous year questions
Thermodynamics, Kinetics and Phase Transformations
GATE XE previous year questions
Comments
Ask a question, share your approach, or help someone understand.
Log in to view the discussion
You’re not logged in. Log in or create an account to see discussions and add comments.