
Engineering Sciences
GATE XE format:mcq PYQs
Build your understanding with focused practice from past exam papers.
Questions 131–140 of 959. Imported answers require independent review unless marked reviewed.
Question 47
Open questionXE-CMCQ1 markNeeds review
For Al – 4.5 wt% Cu alloy, the correct sequence of precipitation during age hardening at room temperature is
Your answerChoose one option.
Log in to check the answer
You can attempt this question now. Sign in to view the answer key, explanations and discussion.Log in to check answerQuestion 53
Open questionXE-CMCQ2 marksNeeds review
In an FCC crystal with lattice parameter a, consider the reaction of two leading partial dislocations, AB and CD, at the line of intersection of their slip planes (111) and (11̄1), respectively, as shown in the figure below. Dislocations, AB and CD, have Burgers vectors
and
, respectively, as given in the figure. Which one of the following options for the slip plane and the Burgers vector of the resulting dislocation is correct? 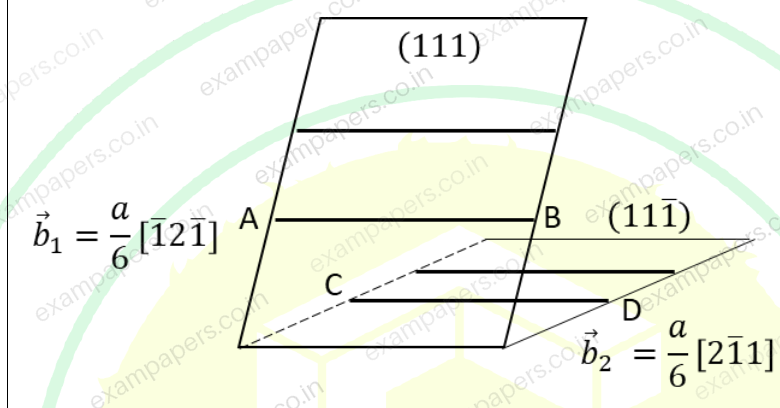
Your answerChoose one option.
Log in to check the answer
You can attempt this question now. Sign in to view the answer key, explanations and discussion.Log in to check answerQuestion 54
Open questionXE-CMCQ2 marksNeeds review
Match the detector for a scanning electron microscope (SEM) in Column I with the resulting output in Column II.
SE: Secondary electrons; BSE: Backscattered electrons;
EDS: Energy Dispersive Spectroscopy; EBSD: Electron Backscatter Diffraction
Column I
(P) SE Detector
(Q) BSE Detector
(R) EDS Detector
(S) EBSD Detector
Column II
(1) Elemental composition analysis
(2) Kikuchi lines
(3) Topographic image
(4) Compositional contrast image
Your answerChoose one option.
Log in to check the answer
You can attempt this question now. Sign in to view the answer key, explanations and discussion.Log in to check answerQuestion 55
Open questionXE-CMCQ2 marksNeeds review
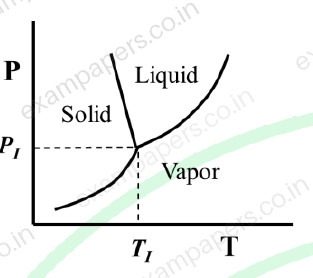
The triple point
is shown in a schematic phase diagram (pressure (P) – temperature (T) plot) for one component system.
,
and
are the free energies of solid, liquid and vapor, respectively. At a constant pressure,
, the correct free energy (G) versus temperature (T) plot is
Your answerChoose one option.
Log in to check the answer
You can attempt this question now. Sign in to view the answer key, explanations and discussion.Log in to check answerQuestion 56
Open questionXE-CMCQ2 marksNeeds review
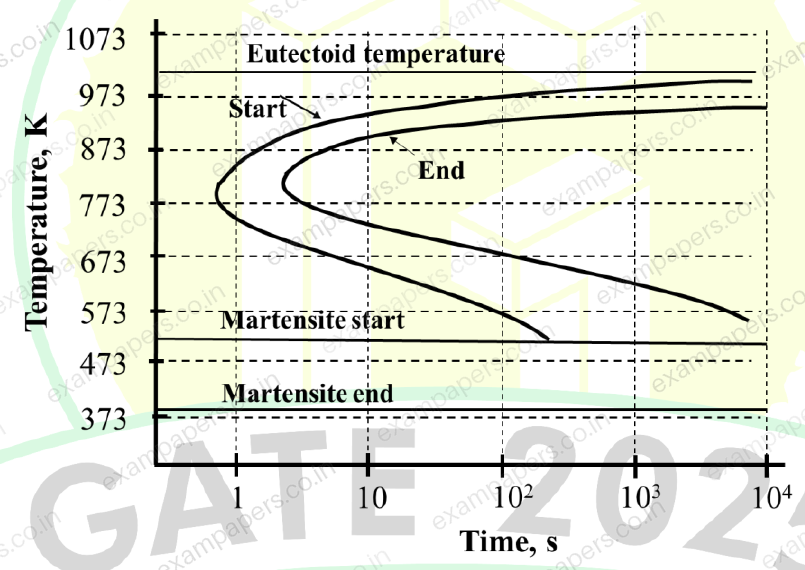
The TTT diagram for eutectoid steel is shown below. The steel after complete austenitization at 1073 K is rapidly cooled to different temperatures and held for varying times (as indicated in Column I) followed by quenching to 300 K. Assuming isothermal transformation, match the heat treatment conditions in Column I with the corresponding microstructure in Column II.
Column I Column II
(P) Held at 300 K indefinitely (1) Bainite
(Q) Held at 873 K for 4 minutes (2) Martensite
(R) Held at 673 K for 20 minutes (3) Pearlite
(S) Held at 623 K for 2 minutes (4) Bainite + Martensite
Your answerChoose one option.
Log in to check the answer
You can attempt this question now. Sign in to view the answer key, explanations and discussion.Log in to check answerQuestion 66
Open questionXE-DMCQ1 markNeeds review
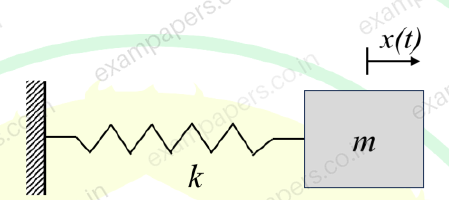
Consider a spring-mass system with mass m and spring stiffness k as shown in the illustration. At time t=0, the mass is displaced by P units and the velocity of the mass is zero. The displacement of the mass, x(t), is measured from the equilibrium position.
Which one of the following functions represent x(t)?
Your answerChoose one option.
Log in to check the answer
You can attempt this question now. Sign in to view the answer key, explanations and discussion.Log in to check answerQuestion 67
Open questionXE-DMCQ1 markNeeds review
A ball of mass
approaches a stationary ball of mass
with horizontal velocity of 2 m/s from left to right. After a perfectly elastic central collision, the horizontal velocity of the heavier ball is 1 m/s from left to right.Which one of the following statements, regarding the velocity (in m/s) of the lighter ball after impact, is TRUE?
Your answerChoose one option.
Log in to check the answer
You can attempt this question now. Sign in to view the answer key, explanations and discussion.Log in to check answerQuestion 68
Open questionXE-DMCQ1 markNeeds review
The Mohr’s circle corresponding to an infinitesimal element is shown in the figure. The plane PQ in the infinitesimal element, at an angle of
from the x-axis, is in a state of pure shear.Which one of the following values of
(in degrees) is CORRECT? 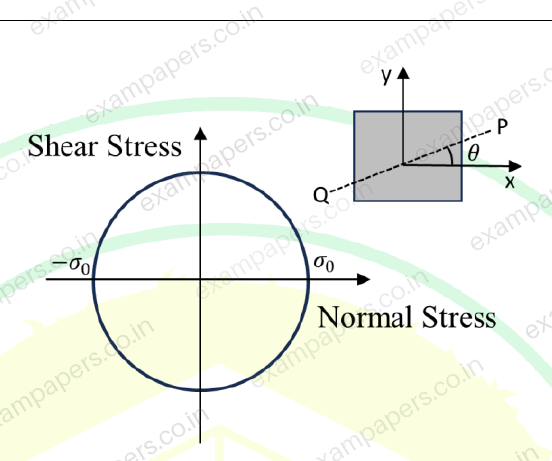
Your answerChoose one option.
Log in to check the answer
You can attempt this question now. Sign in to view the answer key, explanations and discussion.Log in to check answerQuestion 69
Open questionXE-DMCQ1 markNeeds review
The two-dimensional state of stress, in an infinitesimal element, is given by
,
and
.Which one of the following options is the maximum shear stress (in MPa) in the element?
Your answerChoose one option.
Log in to check the answer
You can attempt this question now. Sign in to view the answer key, explanations and discussion.Log in to check answerQuestion 70
Open questionXE-DMCQ1 markNeeds review
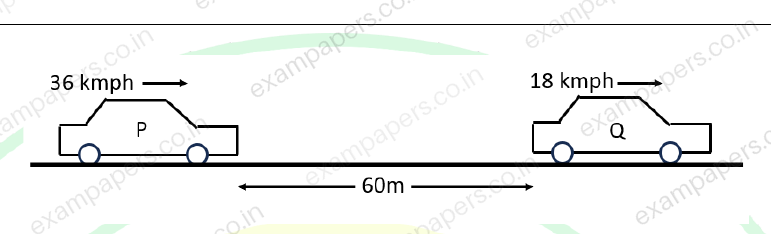
Two cars P and Q are travelling on a straight path and are 60 m apart as shown in the figure; Car P is moving with a constant velocity of 36 kmph, while car Q is moving at a constant velocity of 18 kmph. At this instant, the driver in car P applies the brake and collision occurs with car Q after 30 seconds.
Assuming uniform deceleration due to braking, which one of the following is the CORRECT velocity (in m/s) of the car P just before the collision?
Your answerChoose one option.
Log in to check the answer
You can attempt this question now. Sign in to view the answer key, explanations and discussion.Log in to check answer